29
/
en
AIzaSyAYiBZKx7MnpbEhh9jyipgxe19OcubqV5w
April 1, 2024
240284
Singapore
SGP
true
2
1
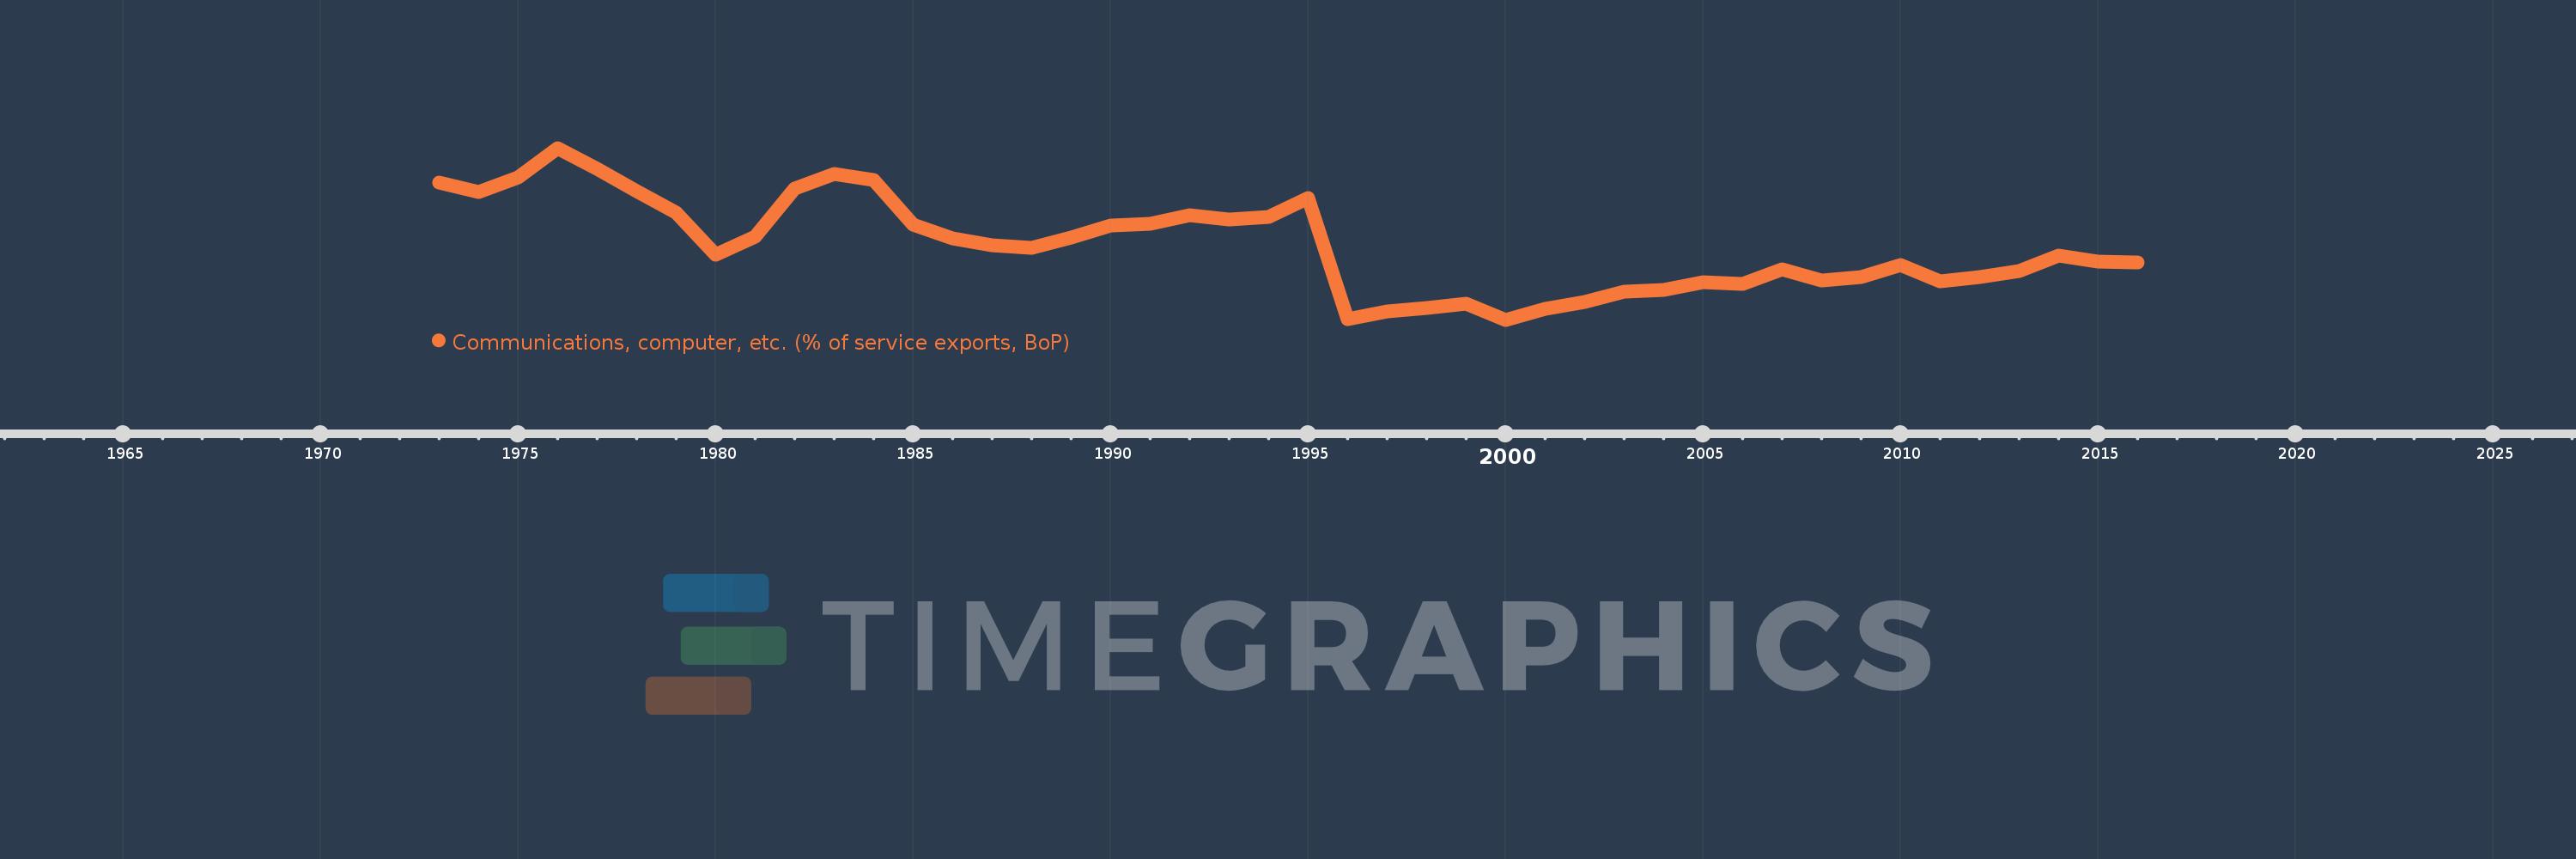
Communications, computer, etc. (% of service exports, BoP)
2016,2015,2014,2013,2012,2011,2010,2009,2008,2007,2006,2005,2004,2003,2002,2001,2000,1999,1998,1997,1996,1995,1994,1993,1992,1991,1990,1989,1988,1987,1986,1985,1984,1983,1982,1981,1980,1979,1978,1977,1976,1975,1974,1973
This statistics in other country:
AfghanistanAlbaniaAlgeriaAngolaAntigua and BarbudaArab WorldArgentinaArmeniaArubaAustraliaAustriaAzerbaijanBahamas, TheBahrainBangladeshBarbadosBelarusBelgiumBelizeBeninBermudaBhutanBoliviaBosnia and HerzegovinaBotswanaBrazilBrunei DarussalamBulgariaBurkina FasoBurundiCabo VerdeCambodiaCameroonCanadaCaribbean small statesCentral African RepublicCentral Europe and the BalticsChadChileChinaColombiaComorosCongo, Dem. Rep.Congo, Rep.Costa RicaCote d'IvoireCroatiaCuracaoCyprusCzech RepublicDenmarkDjiboutiDominicaDominican RepublicEarly-demographic dividendEast Asia & PacificEast Asia & Pacific (excluding high income)East Asia & Pacific (IDA & IBRD countries)EcuadorEgypt, Arab Rep.El SalvadorEquatorial GuineaEritreaEstoniaEthiopiaEuro areaEurope & Central AsiaEurope & Central Asia (excluding high income)Europe & Central Asia (IDA & IBRD countries)European UnionFaroe IslandsFijiFinlandFragile and conflict affected situationsFranceFrench PolynesiaGabonGambia, TheGeorgiaGermanyGhanaGreeceGrenadaGuatemalaGuineaGuinea-BissauGuyanaHaitiHeavily indebted poor countries (HIPC)High incomeHondurasHong Kong SAR, ChinaHungaryIBRD onlyIcelandIDA & IBRD totalIDA onlyIDA totalIndiaIndonesiaIran, Islamic Rep.IraqIrelandIsraelItalyJamaicaJapanJordanKazakhstanKenyaKiribatiKorea, Rep.KosovoKuwaitKyrgyz RepublicLao PDRLate-demographic dividendLatin America & Caribbean Latin America & Caribbean (excluding high income)Latin America & the Caribbean (IDA & IBRD countries)LatviaLeast developed countries: UN classificationLebanonLesothoLiberiaLibyaLithuaniaLow & middle incomeLow incomeLower middle incomeLuxembourgMacao SAR, ChinaMacedonia, FYRMadagascarMalawiMalaysiaMaldivesMaliMaltaMarshall IslandsMauritaniaMauritiusMexicoMicronesia, Fed. Sts.Middle East & North AfricaMiddle East & North Africa (excluding high income)Middle East & North Africa (IDA & IBRD countries)Middle incomeMoldovaMongoliaMontenegroMoroccoMozambiqueMyanmarNamibiaNepalNetherlandsNew CaledoniaNew ZealandNicaraguaNigerNigeriaNorth AmericaNorwayOECD membersOmanOther small statesPacific island small statesPakistanPalauPanamaPapua New GuineaParaguayPeruPhilippinesPolandPortugalPost-demographic dividendPre-demographic dividendQatarRomaniaRussian FederationRwandaSamoaSao Tome and PrincipeSaudi ArabiaSenegalSerbiaSeychellesSierra LeoneSingaporeSint Maarten (Dutch part)Slovak RepublicSloveniaSmall statesSolomon IslandsSouth AfricaSouth AsiaSouth Asia (IDA & IBRD)South SudanSpainSri LankaSt. Kitts and NevisSt. LuciaSt. Vincent and the GrenadinesSub-Saharan Africa Sub-Saharan Africa (excluding high income)Sub-Saharan Africa (IDA & IBRD countries)SudanSurinameSwazilandSwedenSwitzerlandSyrian Arab RepublicTajikistanTanzaniaThailandTimor-LesteTogoTongaTrinidad and TobagoTunisiaTurkeyTuvaluUgandaUkraineUnited KingdomUnited StatesUpper middle incomeUruguayVanuatuVenezuela, RBWest Bank and GazaWorldYemen, Rep.ZambiaZimbabwe Timeline:
This timeline shows a graph from 1973 to 2016 of Singapore. No data until 1972. Number of actual observations by date: 44.
Source name:
World Development Indicators
Source organization:
International Monetary Fund, Balance of Payments Statistics Yearbook and data files.
Categories, topics:
Economy & Growth, Trade
Last updated:
apr 23, 2017
Indicators value changes by year
Minimum:
22.872
jan 1, 2000
Maximum:
63.519
jan 1, 1976
At the date of observation
Value
Absolute change
Change from previous value
jan 1, 1973
55.255
+55.255
0.0%
jan 1, 1974
53.117
-2.139
-3.87%
jan 1, 1975
56.545
+3.428
6.45%
jan 1, 1976
63.519
+6.974
12.33%
jan 1, 1977
58.493
-5.026
-7.91%
jan 1, 1978
53.208
-5.285
-9.04%
jan 1, 1979
48.291
-4.917
-9.24%
jan 1, 1980
38.347
-9.944
-20.59%
jan 1, 1981
42.455
+4.107
10.71%
jan 1, 1982
53.812
+11.357
26.75%
jan 1, 1983
57.273
+3.461
6.43%
jan 1, 1984
55.841
-1.431
-2.5%
jan 1, 1985
45.349
-10.493
-18.79%
jan 1, 1986
42.069
-3.28
-7.23%
jan 1, 1987
40.497
-1.572
-3.74%
jan 1, 1988
39.964
-0.533
-1.32%
jan 1, 1989
42.325
+2.36
5.91%
jan 1, 1990
45.205
+2.88
6.81%
jan 1, 1991
45.646
+0.441
0.97%
jan 1, 1992
47.571
+1.925
4.22%
jan 1, 1993
46.523
-1.047
-2.2%
jan 1, 1994
47.136
+0.613
1.32%
jan 1, 1995
51.6
+4.464
9.47%
jan 1, 1996
23.05
-28.55
-55.33%
jan 1, 1997
24.866
+1.816
7.88%
jan 1, 1998
25.626
+0.76
3.06%
jan 1, 1999
26.693
+1.068
4.17%
jan 1, 2000
22.872
-3.821
-14.31%
jan 1, 2001
25.442
+2.57
11.24%
jan 1, 2002
27.168
+1.726
6.78%
jan 1, 2003
29.453
+2.285
8.41%
jan 1, 2004
29.872
+0.419
1.42%
jan 1, 2005
31.791
+1.92
6.43%
jan 1, 2006
31.339
-0.452
-1.42%
jan 1, 2007
34.868
+3.529
11.26%
jan 1, 2008
32.176
-2.691
-7.72%
jan 1, 2009
33.041
+0.864
2.69%
jan 1, 2010
35.796
+2.755
8.34%
jan 1, 2011
31.933
-3.862
-10.79%
jan 1, 2012
33.052
+1.119
3.5%
jan 1, 2013
34.488
+1.436
4.34%
jan 1, 2014
37.957
+3.469
10.06%
jan 1, 2015
36.572
-1.385
-3.65%
jan 1, 2016
36.349
-0.223
-0.61%
Ranking of countries by current statistics by years


Comments: