29
/
en
AIzaSyAYiBZKx7MnpbEhh9jyipgxe19OcubqV5w
April 1, 2024
89799
Botswana
BWA
true
2
1
GDP growth (annual %)
2016,2015,2014,2013,2012,2011,2010,2009,2008,2007,2006,2005,2004,2003,2002,2001,2000,1999,1998,1997,1996,1995,1994,1993,1992,1991,1990,1989,1988,1987,1986,1985,1984,1983,1982,1981,1980,1979,1978,1977,1976,1975,1974,1973,1972,1971,1970,1969,1968,1967,1966,1965,1964,1963,1962
This statistics in other country:
AfghanistanAlbaniaAlgeriaAndorraAngolaAntigua and BarbudaArab WorldArgentinaArmeniaArubaAustraliaAustriaAzerbaijanBahamas, TheBahrainBangladeshBarbadosBelarusBelgiumBelizeBeninBermudaBhutanBoliviaBosnia and HerzegovinaBotswanaBrazilBrunei DarussalamBulgariaBurkina FasoBurundiCabo VerdeCambodiaCameroonCanadaCaribbean small statesCayman IslandsCentral African RepublicCentral Europe and the BalticsChadChannel IslandsChileChinaColombiaComorosCongo, Dem. Rep.Congo, Rep.Costa RicaCote d'IvoireCroatiaCubaCyprusCzech RepublicDenmarkDjiboutiDominicaDominican RepublicEarly-demographic dividendEast Asia & PacificEast Asia & Pacific (excluding high income)East Asia & Pacific (IDA & IBRD countries)EcuadorEgypt, Arab Rep.El SalvadorEquatorial GuineaEritreaEstoniaEthiopiaEuro areaEurope & Central AsiaEurope & Central Asia (excluding high income)Europe & Central Asia (IDA & IBRD countries)European UnionFijiFinlandFragile and conflict affected situationsFranceFrench PolynesiaGabonGambia, TheGeorgiaGermanyGhanaGreeceGreenlandGrenadaGuatemalaGuineaGuinea-BissauGuyanaHaitiHeavily indebted poor countries (HIPC)High incomeHondurasHong Kong SAR, ChinaHungaryIBRD onlyIcelandIDA & IBRD totalIDA blendIDA onlyIDA totalIndiaIndonesiaIran, Islamic Rep.IraqIrelandIsle of ManIsraelItalyJamaicaJapanJordanKazakhstanKenyaKiribatiKorea, Rep.KosovoKuwaitKyrgyz RepublicLao PDRLate-demographic dividendLatin America & Caribbean Latin America & Caribbean (excluding high income)Latin America & the Caribbean (IDA & IBRD countries)LatviaLeast developed countries: UN classificationLebanonLesothoLiberiaLibyaLiechtensteinLithuaniaLow & middle incomeLow incomeLower middle incomeLuxembourgMacao SAR, ChinaMacedonia, FYRMadagascarMalawiMalaysiaMaldivesMaliMaltaMarshall IslandsMauritaniaMauritiusMexicoMicronesia, Fed. Sts.Middle East & North AfricaMiddle East & North Africa (excluding high income)Middle East & North Africa (IDA & IBRD countries)Middle incomeMoldovaMonacoMongoliaMontenegroMoroccoMozambiqueMyanmarNamibiaNauruNepalNetherlandsNew CaledoniaNew ZealandNicaraguaNigerNigeriaNorth AmericaNorwayOECD membersOmanOther small statesPacific island small statesPakistanPalauPanamaPapua New GuineaParaguayPeruPhilippinesPolandPortugalPost-demographic dividendPre-demographic dividendPuerto RicoQatarRomaniaRussian FederationRwandaSamoaSan MarinoSao Tome and PrincipeSaudi ArabiaSenegalSerbiaSeychellesSierra LeoneSingaporeSlovak RepublicSloveniaSmall statesSolomon IslandsSomaliaSouth AfricaSouth AsiaSouth Asia (IDA & IBRD)South SudanSpainSri LankaSt. Kitts and NevisSt. LuciaSt. Vincent and the GrenadinesSub-Saharan Africa Sub-Saharan Africa (excluding high income)Sub-Saharan Africa (IDA & IBRD countries)SudanSurinameSwazilandSwedenSwitzerlandSyrian Arab RepublicTajikistanTanzaniaThailandTimor-LesteTogoTongaTrinidad and TobagoTunisiaTurkeyTurkmenistanTuvaluUgandaUkraineUnited Arab EmiratesUnited KingdomUnited StatesUpper middle incomeUruguayUzbekistanVanuatuVenezuela, RBVietnamVirgin Islands (U.S.)West Bank and GazaWorldYemen, Rep.ZambiaZimbabwe Timeline:
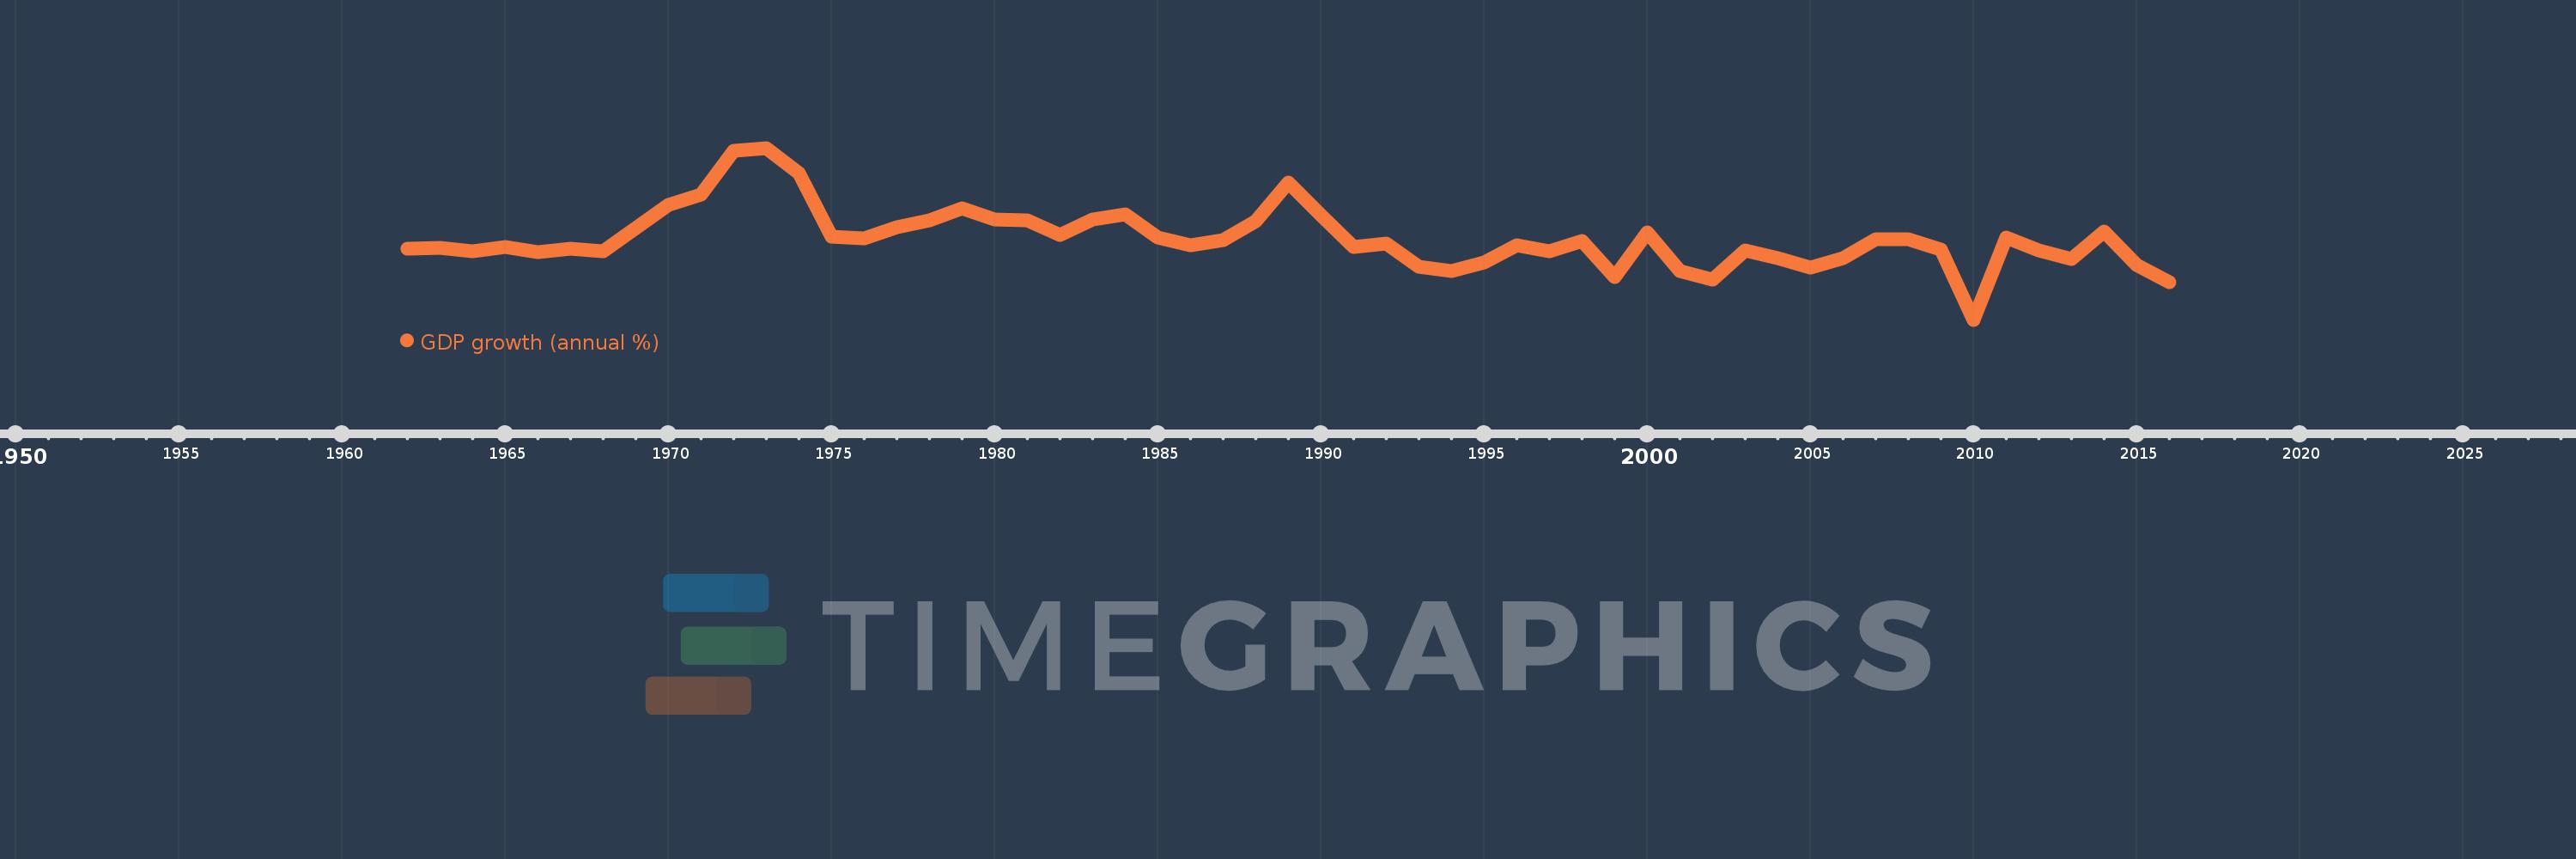
This timeline shows a graph from 1962 to 2016 of Botswana. No data until 1961. Number of actual observations by date: 55.
Source name:
World Development Indicators
Source organization:
World Bank national accounts data, and OECD National Accounts data files.
Categories, topics:
Economy & Growth
Last updated:
apr 23, 2017
Indicators value changes by year
Minimum:
-7.652
jan 1, 2010
Maximum:
26.362
jan 1, 1973
At the date of observation
Value
Absolute change
Change from previous value
jan 1, 1962
6.343
+6.343
0.0%
jan 1, 1963
6.667
+0.323
5.1%
jan 1, 1964
5.921
-0.746
-11.18%
jan 1, 1965
6.832
+0.911
15.39%
jan 1, 1966
5.814
-1.018
-14.9%
jan 1, 1967
6.344
+0.53
9.12%
jan 1, 1968
5.925
-0.419
-6.61%
jan 1, 1969
10.567
+4.642
78.36%
jan 1, 1970
15.123
+4.556
43.12%
jan 1, 1971
17.12
+1.997
13.2%
jan 1, 1972
25.821
+8.701
50.82%
jan 1, 1973
26.362
+0.541
2.09%
jan 1, 1974
21.303
-5.059
-19.19%
jan 1, 1975
8.798
-12.505
-58.7%
jan 1, 1976
8.446
-0.352
-4.0%
jan 1, 1977
10.647
+2.201
26.06%
jan 1, 1978
12.012
+1.365
12.82%
jan 1, 1979
14.333
+2.321
19.32%
jan 1, 1980
12.149
-2.184
-15.24%
jan 1, 1981
11.987
-0.162
-1.33%
jan 1, 1982
9.065
-2.922
-24.38%
jan 1, 1983
12.166
+3.101
34.21%
jan 1, 1984
13.147
+0.981
8.07%
jan 1, 1985
8.545
-4.601
-35.0%
jan 1, 1986
7.125
-1.42
-16.62%
jan 1, 1987
8.173
+1.048
14.7%
jan 1, 1988
11.882
+3.709
45.38%
jan 1, 1989
19.45
+7.568
63.69%
jan 1, 1990
13.059
-6.391
-32.86%
jan 1, 1991
6.773
-6.287
-48.14%
jan 1, 1992
7.459
+0.686
10.13%
jan 1, 1993
2.917
-4.542
-60.89%
jan 1, 1994
1.916
-1.001
-34.31%
jan 1, 1995
3.628
+1.712
89.34%
jan 1, 1996
7.03
+3.402
93.79%
jan 1, 1997
5.83
-1.201
-17.08%
jan 1, 1998
8.027
+2.197
37.68%
jan 1, 1999
0.722
-7.305
-91.0%
jan 1, 2000
9.667
+8.945
1.24K%
jan 1, 2001
1.988
-7.68
-79.44%
jan 1, 2002
0.251
-1.737
-87.39%
jan 1, 2003
6.07
+5.819
2.32K%
jan 1, 2004
4.626
-1.444
-23.78%
jan 1, 2005
2.706
-1.92
-41.51%
jan 1, 2006
4.557
+1.851
68.4%
jan 1, 2007
8.364
+3.807
83.55%
jan 1, 2008
8.277
-0.087
-1.04%
jan 1, 2009
6.245
-2.031
-24.54%
jan 1, 2010
-7.652
-13.898
-222.53%
jan 1, 2011
8.564
+16.216
-211.91%
jan 1, 2012
6.048
-2.515
-29.37%
jan 1, 2013
4.456
-1.592
-26.32%
jan 1, 2014
9.86
+5.404
121.27%
jan 1, 2015
3.205
-6.655
-67.5%
jan 1, 2016
-0.255
-3.46
-107.95%
Ranking of countries by current statistics by years


Comments: