29
/
en
AIzaSyAYiBZKx7MnpbEhh9jyipgxe19OcubqV5w
April 1, 2024
158444
Iraq
IRQ
true
2
1
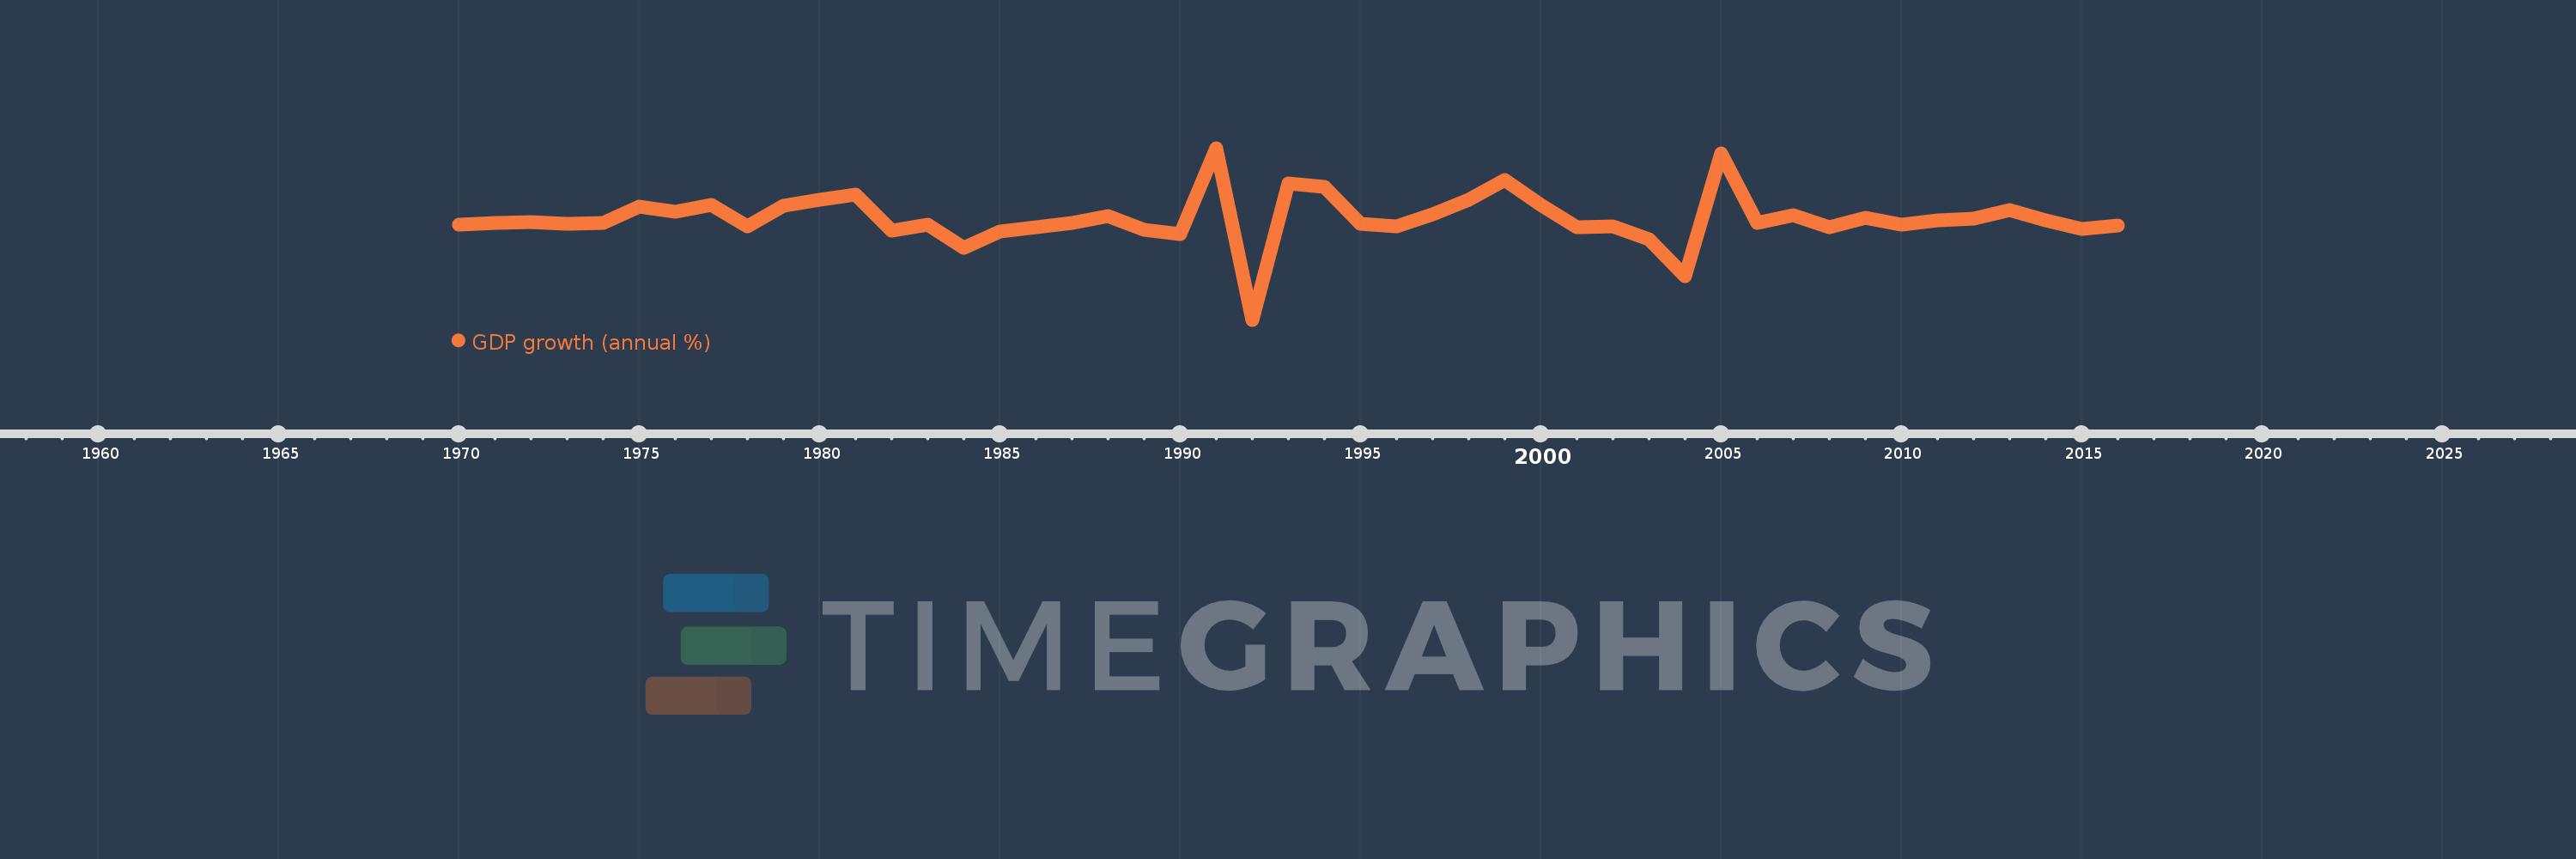
GDP growth (annual %)
2016,2015,2014,2013,2012,2011,2010,2009,2008,2007,2006,2005,2004,2003,2002,2001,2000,1999,1998,1997,1996,1995,1994,1993,1992,1991,1990,1989,1988,1987,1986,1985,1984,1983,1982,1981,1980,1979,1978,1977,1976,1975,1974,1973,1972,1971,1970
This statistics in other country:
AfghanistanAlbaniaAlgeriaAndorraAngolaAntigua and BarbudaArab WorldArgentinaArmeniaArubaAustraliaAustriaAzerbaijanBahamas, TheBahrainBangladeshBarbadosBelarusBelgiumBelizeBeninBermudaBhutanBoliviaBosnia and HerzegovinaBotswanaBrazilBrunei DarussalamBulgariaBurkina FasoBurundiCabo VerdeCambodiaCameroonCanadaCaribbean small statesCayman IslandsCentral African RepublicCentral Europe and the BalticsChadChannel IslandsChileChinaColombiaComorosCongo, Dem. Rep.Congo, Rep.Costa RicaCote d'IvoireCroatiaCubaCyprusCzech RepublicDenmarkDjiboutiDominicaDominican RepublicEarly-demographic dividendEast Asia & PacificEast Asia & Pacific (excluding high income)East Asia & Pacific (IDA & IBRD countries)EcuadorEgypt, Arab Rep.El SalvadorEquatorial GuineaEritreaEstoniaEthiopiaEuro areaEurope & Central AsiaEurope & Central Asia (excluding high income)Europe & Central Asia (IDA & IBRD countries)European UnionFijiFinlandFragile and conflict affected situationsFranceFrench PolynesiaGabonGambia, TheGeorgiaGermanyGhanaGreeceGreenlandGrenadaGuatemalaGuineaGuinea-BissauGuyanaHaitiHeavily indebted poor countries (HIPC)High incomeHondurasHong Kong SAR, ChinaHungaryIBRD onlyIcelandIDA & IBRD totalIDA blendIDA onlyIDA totalIndiaIndonesiaIran, Islamic Rep.IraqIrelandIsle of ManIsraelItalyJamaicaJapanJordanKazakhstanKenyaKiribatiKorea, Rep.KosovoKuwaitKyrgyz RepublicLao PDRLate-demographic dividendLatin America & Caribbean Latin America & Caribbean (excluding high income)Latin America & the Caribbean (IDA & IBRD countries)LatviaLeast developed countries: UN classificationLebanonLesothoLiberiaLibyaLiechtensteinLithuaniaLow & middle incomeLow incomeLower middle incomeLuxembourgMacao SAR, ChinaMacedonia, FYRMadagascarMalawiMalaysiaMaldivesMaliMaltaMarshall IslandsMauritaniaMauritiusMexicoMicronesia, Fed. Sts.Middle East & North AfricaMiddle East & North Africa (excluding high income)Middle East & North Africa (IDA & IBRD countries)Middle incomeMoldovaMonacoMongoliaMontenegroMoroccoMozambiqueMyanmarNamibiaNauruNepalNetherlandsNew CaledoniaNew ZealandNicaraguaNigerNigeriaNorth AmericaNorwayOECD membersOmanOther small statesPacific island small statesPakistanPalauPanamaPapua New GuineaParaguayPeruPhilippinesPolandPortugalPost-demographic dividendPre-demographic dividendPuerto RicoQatarRomaniaRussian FederationRwandaSamoaSan MarinoSao Tome and PrincipeSaudi ArabiaSenegalSerbiaSeychellesSierra LeoneSingaporeSlovak RepublicSloveniaSmall statesSolomon IslandsSomaliaSouth AfricaSouth AsiaSouth Asia (IDA & IBRD)South SudanSpainSri LankaSt. Kitts and NevisSt. LuciaSt. Vincent and the GrenadinesSub-Saharan Africa Sub-Saharan Africa (excluding high income)Sub-Saharan Africa (IDA & IBRD countries)SudanSurinameSwazilandSwedenSwitzerlandSyrian Arab RepublicTajikistanTanzaniaThailandTimor-LesteTogoTongaTrinidad and TobagoTunisiaTurkeyTurkmenistanTuvaluUgandaUkraineUnited Arab EmiratesUnited KingdomUnited StatesUpper middle incomeUruguayUzbekistanVanuatuVenezuela, RBVietnamVirgin Islands (U.S.)West Bank and GazaWorldYemen, Rep.ZambiaZimbabwe Timeline:
This timeline shows a graph from 1970 to 2016 of Iraq. No data until 1969. Number of actual observations by date: 47.
Source name:
World Development Indicators
Source organization:
World Bank national accounts data, and OECD National Accounts data files.
Categories, topics:
Economy & Growth
Last updated:
apr 23, 2017
Indicators value changes by year
Minimum:
-64.047
jan 1, 1992
Maximum:
57.818
jan 1, 1991
At the date of observation
Value
Absolute change
Change from previous value
jan 1, 1970
3.244
+3.244
0.0%
jan 1, 1971
4.544
+1.3
40.08%
jan 1, 1972
5.375
+0.83
18.27%
jan 1, 1973
3.735
-1.639
-30.5%
jan 1, 1974
4.419
+0.683
18.3%
jan 1, 1975
16.113
+11.695
264.66%
jan 1, 1976
12.491
-3.623
-22.48%
jan 1, 1977
17.175
+4.684
37.5%
jan 1, 1978
1.9
-15.275
-88.94%
jan 1, 1979
17.057
+15.157
797.75%
jan 1, 1980
20.869
+3.812
22.35%
jan 1, 1981
24.754
+3.884
18.61%
jan 1, 1982
-0.729
-25.482
-102.94%
jan 1, 1983
3.434
+4.163
-571.23%
jan 1, 1984
-13.073
-16.507
-480.7%
jan 1, 1985
-1.485
+11.588
-88.64%
jan 1, 1986
1.454
+2.939
-197.89%
jan 1, 1987
4.648
+3.194
219.66%
jan 1, 1988
9.305
+4.658
100.22%
jan 1, 1989
-0.019
-9.324
-100.2%
jan 1, 1990
-3.119
-3.099
16.28K%
jan 1, 1991
57.818
+60.936
-1.95K%
jan 1, 1992
-64.047
-121.865
-210.77%
jan 1, 1993
32.592
+96.639
-150.89%
jan 1, 1994
30.29
-2.302
-7.06%
jan 1, 1995
3.855
-26.435
-87.27%
jan 1, 1996
2.12
-1.735
-45.0%
jan 1, 1997
11.021
+8.901
419.84%
jan 1, 1998
21.238
+10.217
92.71%
jan 1, 1999
34.857
+13.619
64.13%
jan 1, 2000
17.582
-17.275
-49.56%
jan 1, 2001
1.406
-16.176
-92.0%
jan 1, 2002
2.305
+0.899
63.91%
jan 1, 2003
-6.9
-9.205
-399.32%
jan 1, 2004
-33.101
-26.201
379.71%
jan 1, 2005
54.158
+87.259
-263.61%
jan 1, 2006
4.401
-49.757
-91.87%
jan 1, 2007
10.158
+5.758
130.84%
jan 1, 2008
1.378
-8.781
-86.44%
jan 1, 2009
8.228
+6.851
497.28%
jan 1, 2010
3.379
-4.849
-58.93%
jan 1, 2011
6.403
+3.023
89.46%
jan 1, 2012
7.546
+1.144
17.87%
jan 1, 2013
13.936
+6.39
84.67%
jan 1, 2014
6.572
-7.364
-52.84%
jan 1, 2015
0.06
-6.512
-99.09%
jan 1, 2016
3.02
+2.96
4.92K%
Ranking of countries by current statistics by years


Comments: