29
/
en
AIzaSyAYiBZKx7MnpbEhh9jyipgxe19OcubqV5w
April 1, 2024
153536
Iceland
ISL
true
2
1
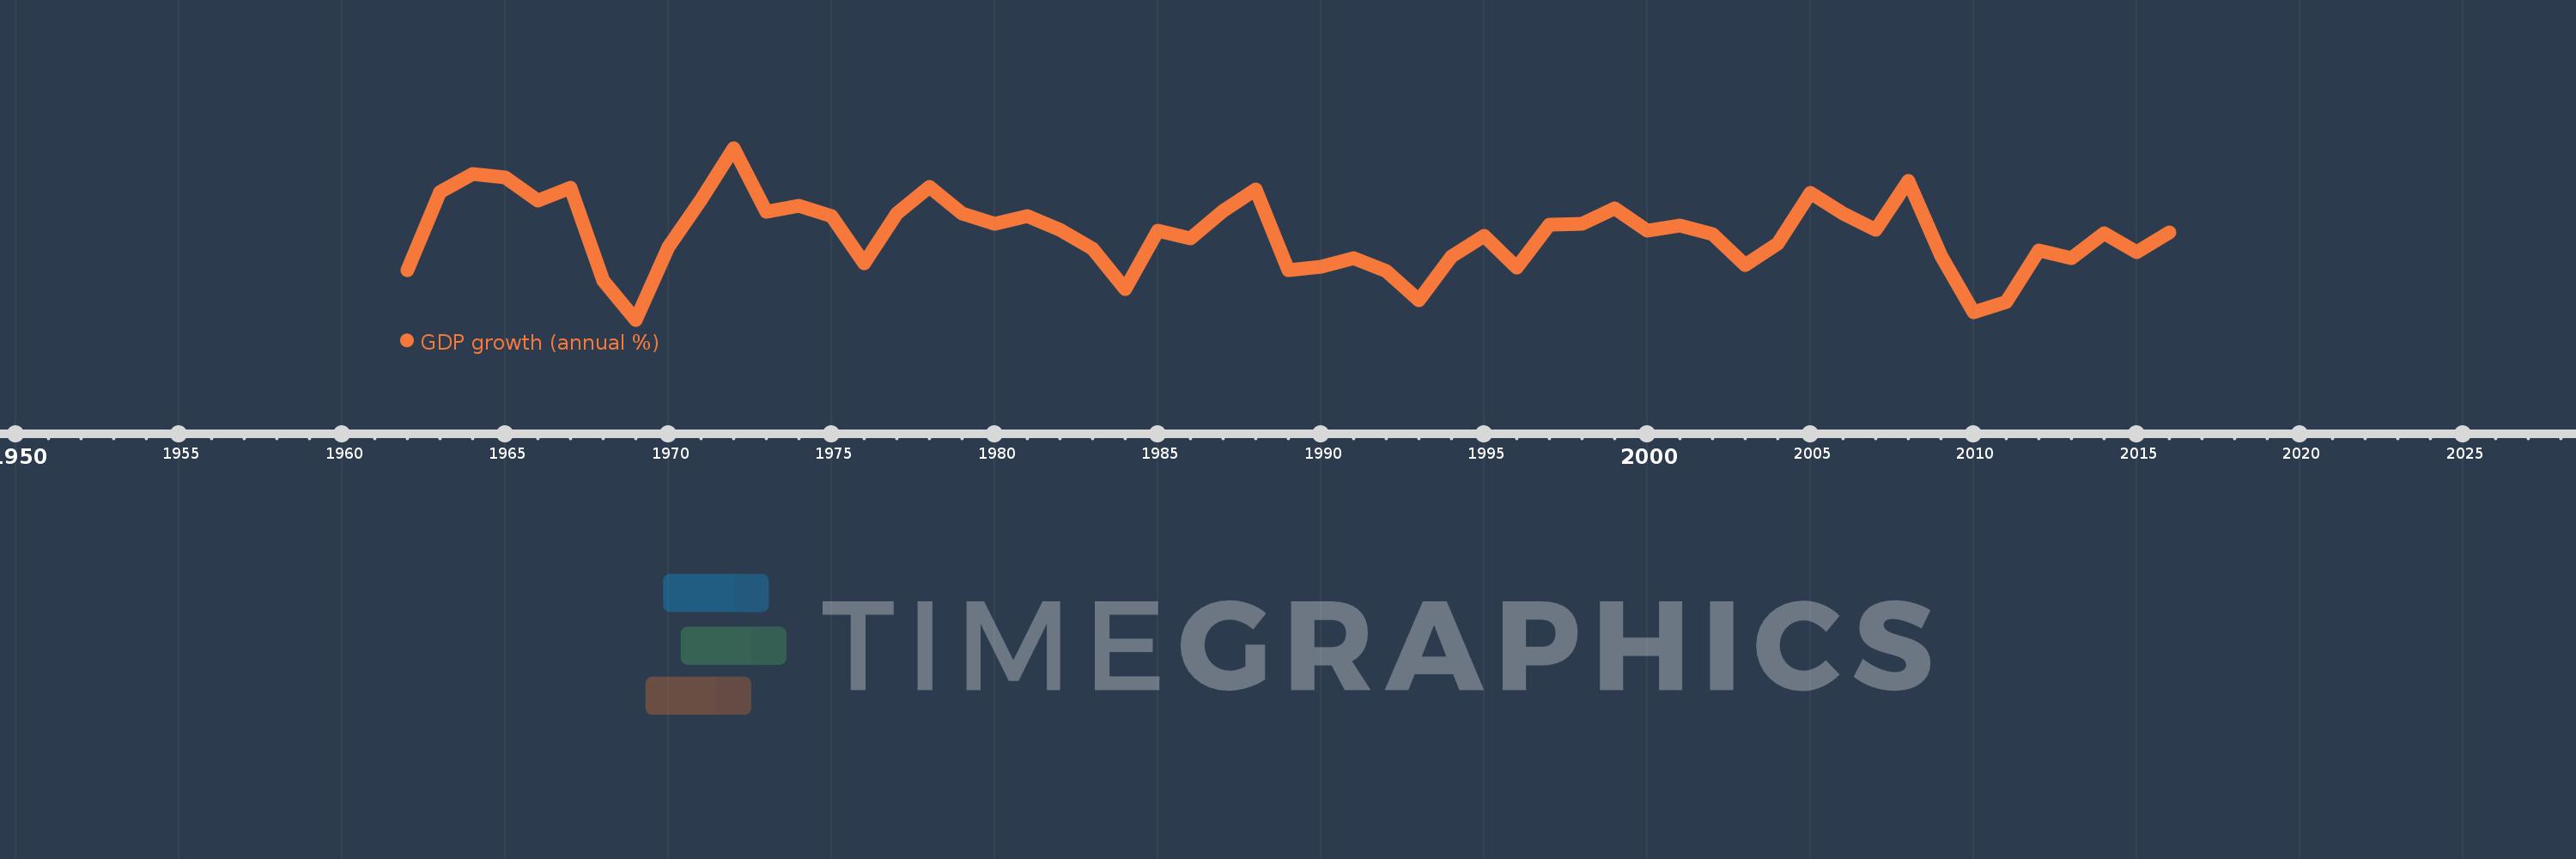
GDP growth (annual %)
2016,2015,2014,2013,2012,2011,2010,2009,2008,2007,2006,2005,2004,2003,2002,2001,2000,1999,1998,1997,1996,1995,1994,1993,1992,1991,1990,1989,1988,1987,1986,1985,1984,1983,1982,1981,1980,1979,1978,1977,1976,1975,1974,1973,1972,1971,1970,1969,1968,1967,1966,1965,1964,1963,1962
This statistics in other country:
AfghanistanAlbaniaAlgeriaAndorraAngolaAntigua and BarbudaArab WorldArgentinaArmeniaArubaAustraliaAustriaAzerbaijanBahamas, TheBahrainBangladeshBarbadosBelarusBelgiumBelizeBeninBermudaBhutanBoliviaBosnia and HerzegovinaBotswanaBrazilBrunei DarussalamBulgariaBurkina FasoBurundiCabo VerdeCambodiaCameroonCanadaCaribbean small statesCayman IslandsCentral African RepublicCentral Europe and the BalticsChadChannel IslandsChileChinaColombiaComorosCongo, Dem. Rep.Congo, Rep.Costa RicaCote d'IvoireCroatiaCubaCyprusCzech RepublicDenmarkDjiboutiDominicaDominican RepublicEarly-demographic dividendEast Asia & PacificEast Asia & Pacific (excluding high income)East Asia & Pacific (IDA & IBRD countries)EcuadorEgypt, Arab Rep.El SalvadorEquatorial GuineaEritreaEstoniaEthiopiaEuro areaEurope & Central AsiaEurope & Central Asia (excluding high income)Europe & Central Asia (IDA & IBRD countries)European UnionFijiFinlandFragile and conflict affected situationsFranceFrench PolynesiaGabonGambia, TheGeorgiaGermanyGhanaGreeceGreenlandGrenadaGuatemalaGuineaGuinea-BissauGuyanaHaitiHeavily indebted poor countries (HIPC)High incomeHondurasHong Kong SAR, ChinaHungaryIBRD onlyIcelandIDA & IBRD totalIDA blendIDA onlyIDA totalIndiaIndonesiaIran, Islamic Rep.IraqIrelandIsle of ManIsraelItalyJamaicaJapanJordanKazakhstanKenyaKiribatiKorea, Rep.KosovoKuwaitKyrgyz RepublicLao PDRLate-demographic dividendLatin America & Caribbean Latin America & Caribbean (excluding high income)Latin America & the Caribbean (IDA & IBRD countries)LatviaLeast developed countries: UN classificationLebanonLesothoLiberiaLibyaLiechtensteinLithuaniaLow & middle incomeLow incomeLower middle incomeLuxembourgMacao SAR, ChinaMacedonia, FYRMadagascarMalawiMalaysiaMaldivesMaliMaltaMarshall IslandsMauritaniaMauritiusMexicoMicronesia, Fed. Sts.Middle East & North AfricaMiddle East & North Africa (excluding high income)Middle East & North Africa (IDA & IBRD countries)Middle incomeMoldovaMonacoMongoliaMontenegroMoroccoMozambiqueMyanmarNamibiaNauruNepalNetherlandsNew CaledoniaNew ZealandNicaraguaNigerNigeriaNorth AmericaNorwayOECD membersOmanOther small statesPacific island small statesPakistanPalauPanamaPapua New GuineaParaguayPeruPhilippinesPolandPortugalPost-demographic dividendPre-demographic dividendPuerto RicoQatarRomaniaRussian FederationRwandaSamoaSan MarinoSao Tome and PrincipeSaudi ArabiaSenegalSerbiaSeychellesSierra LeoneSingaporeSlovak RepublicSloveniaSmall statesSolomon IslandsSomaliaSouth AfricaSouth AsiaSouth Asia (IDA & IBRD)South SudanSpainSri LankaSt. Kitts and NevisSt. LuciaSt. Vincent and the GrenadinesSub-Saharan Africa Sub-Saharan Africa (excluding high income)Sub-Saharan Africa (IDA & IBRD countries)SudanSurinameSwazilandSwedenSwitzerlandSyrian Arab RepublicTajikistanTanzaniaThailandTimor-LesteTogoTongaTrinidad and TobagoTunisiaTurkeyTurkmenistanTuvaluUgandaUkraineUnited Arab EmiratesUnited KingdomUnited StatesUpper middle incomeUruguayUzbekistanVanuatuVenezuela, RBVietnamVirgin Islands (U.S.)West Bank and GazaWorldYemen, Rep.ZambiaZimbabwe Timeline:
This timeline shows a graph from 1962 to 2016 of Iceland. No data until 1961. Number of actual observations by date: 55.
Source name:
World Development Indicators
Source organization:
World Bank national accounts data, and OECD National Accounts data files.
Categories, topics:
Economy & Growth
Last updated:
apr 23, 2017
Indicators value changes by year
Minimum:
-5.475
jan 1, 1969
Maximum:
13.061
jan 1, 1972
At the date of observation
Value
Absolute change
Change from previous value
jan 1, 1962
-0.085
-0.085
0.0%
jan 1, 1963
8.314
+8.398
-9.92K%
jan 1, 1964
10.283
+1.97
23.69%
jan 1, 1965
9.917
-0.367
-3.57%
jan 1, 1966
7.372
-2.545
-25.66%
jan 1, 1967
8.736
+1.364
18.51%
jan 1, 1968
-1.267
-10.003
-114.51%
jan 1, 1969
-5.475
-4.208
332.03%
jan 1, 1970
2.375
+7.849
-143.37%
jan 1, 1971
7.457
+5.082
214.01%
jan 1, 1972
13.061
+5.604
75.16%
jan 1, 1973
6.177
-6.884
-52.7%
jan 1, 1974
6.806
+0.629
10.18%
jan 1, 1975
5.706
-1.1
-16.16%
jan 1, 1976
0.646
-5.06
-88.68%
jan 1, 1977
5.959
+5.313
822.28%
jan 1, 1978
8.822
+2.863
48.04%
jan 1, 1979
6.017
-2.806
-31.8%
jan 1, 1980
4.861
-1.156
-19.22%
jan 1, 1981
5.748
+0.887
18.26%
jan 1, 1982
4.265
-1.483
-25.8%
jan 1, 1983
2.155
-2.11
-49.48%
jan 1, 1984
-2.151
-4.306
-199.84%
jan 1, 1985
4.129
+6.28
-291.95%
jan 1, 1986
3.293
-0.836
-20.25%
jan 1, 1987
6.271
+2.978
90.43%
jan 1, 1988
8.546
+2.275
36.29%
jan 1, 1989
-0.09
-8.636
-101.05%
jan 1, 1990
0.258
+0.348
-388.03%
jan 1, 1991
1.169
+0.911
352.47%
jan 1, 1992
-0.224
-1.393
-119.12%
jan 1, 1993
-3.374
-3.15
1.41K%
jan 1, 1994
1.313
+4.687
-138.93%
jan 1, 1995
3.609
+2.295
174.76%
jan 1, 1996
0.117
-3.492
-96.77%
jan 1, 1997
4.785
+4.668
4.0K%
jan 1, 1998
4.913
+0.128
2.68%
jan 1, 1999
6.52
+1.607
32.7%
jan 1, 2000
4.163
-2.357
-36.15%
jan 1, 2001
4.724
+0.56
13.46%
jan 1, 2002
3.763
-0.961
-20.34%
jan 1, 2003
0.453
-3.309
-87.95%
jan 1, 2004
2.742
+2.288
504.78%
jan 1, 2005
8.22
+5.479
199.81%
jan 1, 2006
5.96
-2.26
-27.49%
jan 1, 2007
4.206
-1.754
-29.43%
jan 1, 2008
9.493
+5.287
125.68%
jan 1, 2009
1.479
-8.014
-84.42%
jan 1, 2010
-4.681
-6.16
-416.56%
jan 1, 2011
-3.589
+1.093
-23.34%
jan 1, 2012
1.988
+5.577
-155.4%
jan 1, 2013
1.183
-0.805
-40.5%
jan 1, 2014
3.896
+2.713
229.35%
jan 1, 2015
1.827
-2.069
-53.11%
jan 1, 2016
3.957
+2.13
116.63%
Ranking of countries by current statistics by years


Comments: