29
/
en
AIzaSyAYiBZKx7MnpbEhh9jyipgxe19OcubqV5w
April 1, 2024
185174
Madagascar
MDG
true
2
1
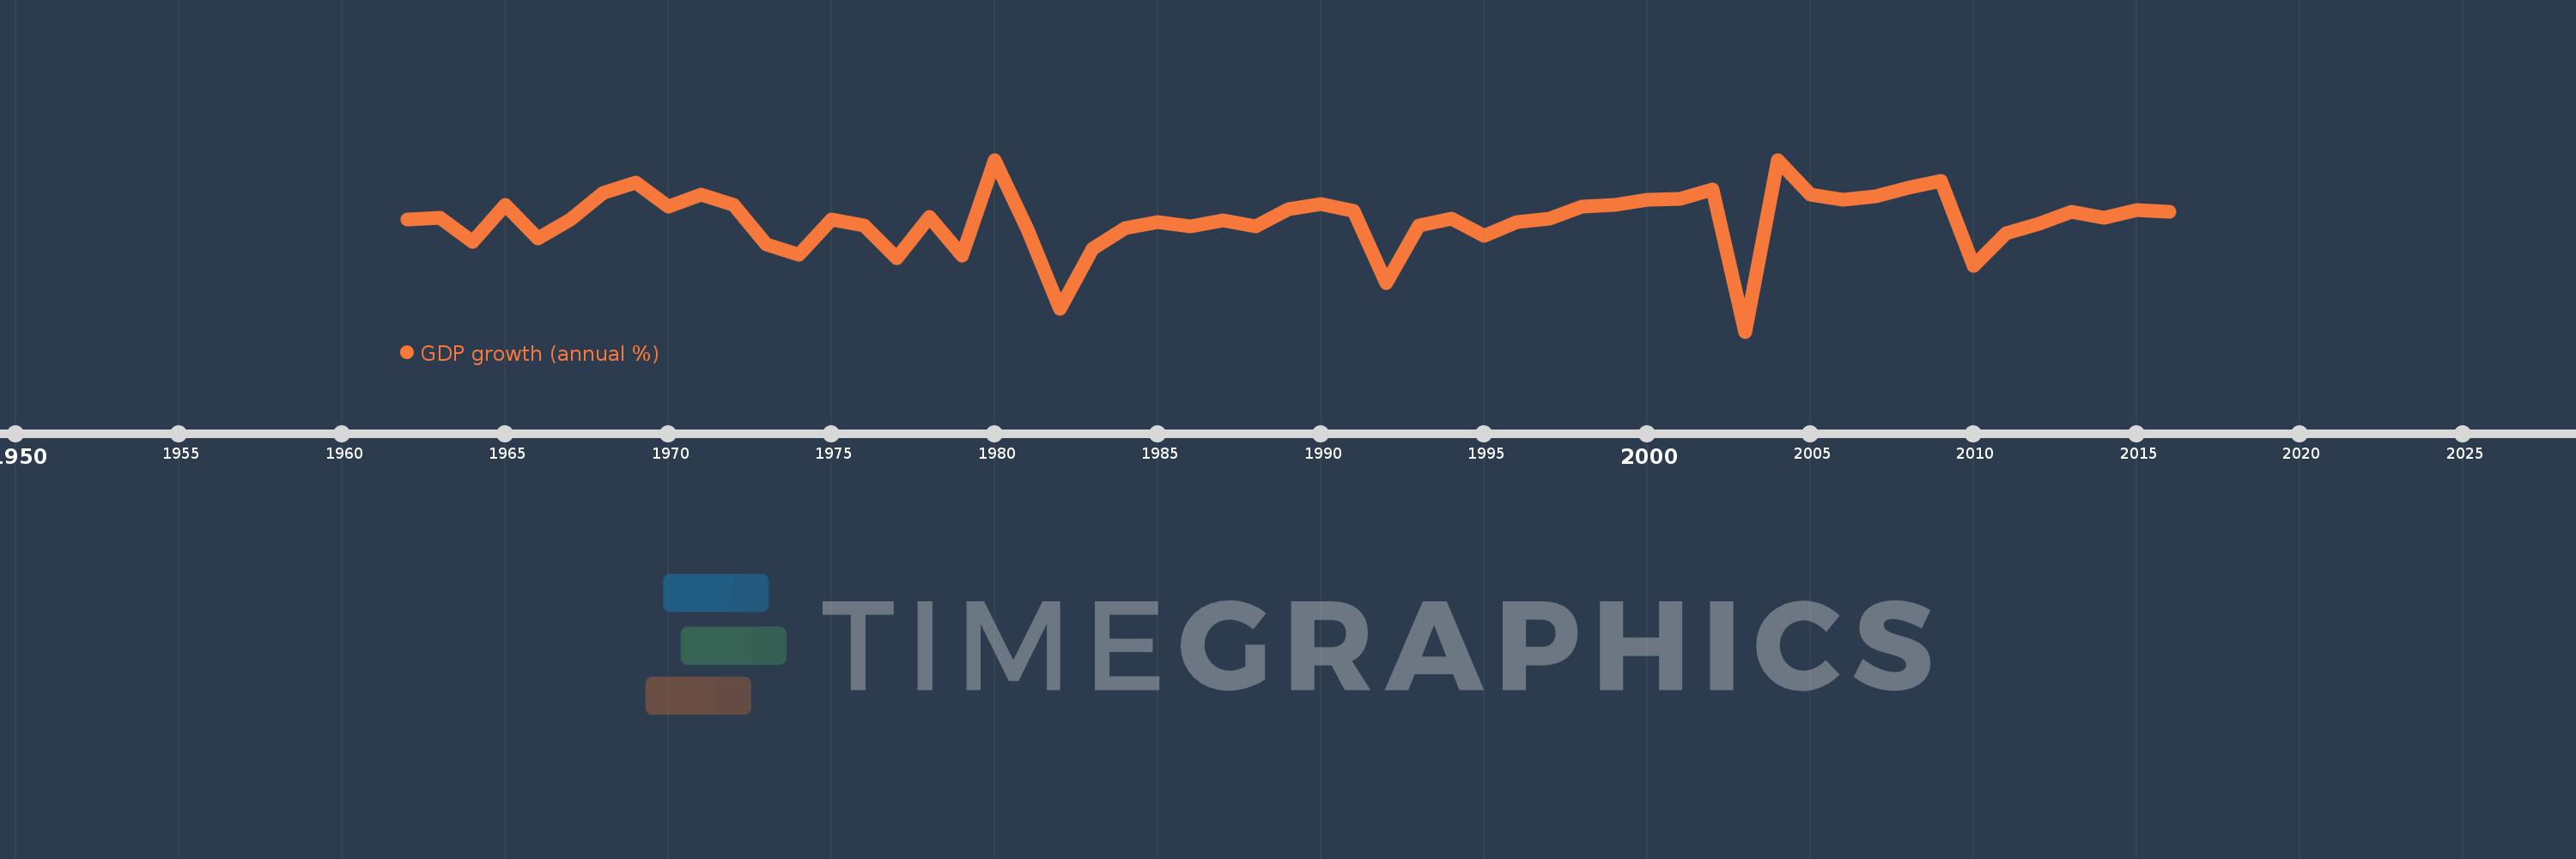
GDP growth (annual %)
2016,2015,2014,2013,2012,2011,2010,2009,2008,2007,2006,2005,2004,2003,2002,2001,2000,1999,1998,1997,1996,1995,1994,1993,1992,1991,1990,1989,1988,1987,1986,1985,1984,1983,1982,1981,1980,1979,1978,1977,1976,1975,1974,1973,1972,1971,1970,1969,1968,1967,1966,1965,1964,1963,1962
This statistics in other country:
AfghanistanAlbaniaAlgeriaAndorraAngolaAntigua and BarbudaArab WorldArgentinaArmeniaArubaAustraliaAustriaAzerbaijanBahamas, TheBahrainBangladeshBarbadosBelarusBelgiumBelizeBeninBermudaBhutanBoliviaBosnia and HerzegovinaBotswanaBrazilBrunei DarussalamBulgariaBurkina FasoBurundiCabo VerdeCambodiaCameroonCanadaCaribbean small statesCayman IslandsCentral African RepublicCentral Europe and the BalticsChadChannel IslandsChileChinaColombiaComorosCongo, Dem. Rep.Congo, Rep.Costa RicaCote d'IvoireCroatiaCubaCyprusCzech RepublicDenmarkDjiboutiDominicaDominican RepublicEarly-demographic dividendEast Asia & PacificEast Asia & Pacific (excluding high income)East Asia & Pacific (IDA & IBRD countries)EcuadorEgypt, Arab Rep.El SalvadorEquatorial GuineaEritreaEstoniaEthiopiaEuro areaEurope & Central AsiaEurope & Central Asia (excluding high income)Europe & Central Asia (IDA & IBRD countries)European UnionFijiFinlandFragile and conflict affected situationsFranceFrench PolynesiaGabonGambia, TheGeorgiaGermanyGhanaGreeceGreenlandGrenadaGuatemalaGuineaGuinea-BissauGuyanaHaitiHeavily indebted poor countries (HIPC)High incomeHondurasHong Kong SAR, ChinaHungaryIBRD onlyIcelandIDA & IBRD totalIDA blendIDA onlyIDA totalIndiaIndonesiaIran, Islamic Rep.IraqIrelandIsle of ManIsraelItalyJamaicaJapanJordanKazakhstanKenyaKiribatiKorea, Rep.KosovoKuwaitKyrgyz RepublicLao PDRLate-demographic dividendLatin America & Caribbean Latin America & Caribbean (excluding high income)Latin America & the Caribbean (IDA & IBRD countries)LatviaLeast developed countries: UN classificationLebanonLesothoLiberiaLibyaLiechtensteinLithuaniaLow & middle incomeLow incomeLower middle incomeLuxembourgMacao SAR, ChinaMacedonia, FYRMadagascarMalawiMalaysiaMaldivesMaliMaltaMarshall IslandsMauritaniaMauritiusMexicoMicronesia, Fed. Sts.Middle East & North AfricaMiddle East & North Africa (excluding high income)Middle East & North Africa (IDA & IBRD countries)Middle incomeMoldovaMonacoMongoliaMontenegroMoroccoMozambiqueMyanmarNamibiaNauruNepalNetherlandsNew CaledoniaNew ZealandNicaraguaNigerNigeriaNorth AmericaNorwayOECD membersOmanOther small statesPacific island small statesPakistanPalauPanamaPapua New GuineaParaguayPeruPhilippinesPolandPortugalPost-demographic dividendPre-demographic dividendPuerto RicoQatarRomaniaRussian FederationRwandaSamoaSan MarinoSao Tome and PrincipeSaudi ArabiaSenegalSerbiaSeychellesSierra LeoneSingaporeSlovak RepublicSloveniaSmall statesSolomon IslandsSomaliaSouth AfricaSouth AsiaSouth Asia (IDA & IBRD)South SudanSpainSri LankaSt. Kitts and NevisSt. LuciaSt. Vincent and the GrenadinesSub-Saharan Africa Sub-Saharan Africa (excluding high income)Sub-Saharan Africa (IDA & IBRD countries)SudanSurinameSwazilandSwedenSwitzerlandSyrian Arab RepublicTajikistanTanzaniaThailandTimor-LesteTogoTongaTrinidad and TobagoTunisiaTurkeyTurkmenistanTuvaluUgandaUkraineUnited Arab EmiratesUnited KingdomUnited StatesUpper middle incomeUruguayUzbekistanVanuatuVenezuela, RBVietnamVirgin Islands (U.S.)West Bank and GazaWorldYemen, Rep.ZambiaZimbabwe Timeline:
This timeline shows a graph from 1962 to 2016 of Madagascar. No data until 1961. Number of actual observations by date: 55.
Source name:
World Development Indicators
Source organization:
World Bank national accounts data, and OECD National Accounts data files.
Categories, topics:
Economy & Growth
Last updated:
apr 23, 2017
Indicators value changes by year
Minimum:
-12.674
jan 1, 2003
At the date of observation
Value
Absolute change
Change from previous value
jan 1, 1962
2.049
+2.049
0.0%
jan 1, 1963
2.271
+0.222
10.86%
jan 1, 1964
-0.929
-3.2
-140.92%
jan 1, 1965
3.963
+4.892
-526.35%
jan 1, 1966
-0.452
-4.415
-111.41%
jan 1, 1967
2.065
+2.517
-556.5%
jan 1, 1968
5.529
+3.464
167.79%
jan 1, 1969
6.829
+1.3
23.52%
jan 1, 1970
3.721
-3.108
-45.51%
jan 1, 1971
5.276
+1.555
41.79%
jan 1, 1972
3.929
-1.347
-25.53%
jan 1, 1973
-1.273
-5.202
-132.39%
jan 1, 1974
-2.618
-1.346
105.75%
jan 1, 1975
2.007
+4.625
-176.64%
jan 1, 1976
1.259
-0.748
-37.28%
jan 1, 1977
-3.069
-4.328
-343.81%
jan 1, 1978
2.364
+5.433
-177.03%
jan 1, 1979
-2.662
-5.026
-212.6%
jan 1, 1980
9.855
+12.516
-470.22%
jan 1, 1981
0.806
-9.049
-91.82%
jan 1, 1982
-9.699
-10.505
-1.3K%
jan 1, 1983
-1.81
+7.889
-81.34%
jan 1, 1984
0.902
+2.712
-149.83%
jan 1, 1985
1.705
+0.803
88.97%
jan 1, 1986
1.156
-0.549
-32.19%
jan 1, 1987
1.959
+0.803
69.49%
jan 1, 1988
1.178
-0.781
-39.87%
jan 1, 1989
3.403
+2.225
188.89%
jan 1, 1990
4.079
+0.675
19.85%
jan 1, 1991
3.13
-0.949
-23.26%
jan 1, 1992
-6.31
-9.44
-301.58%
jan 1, 1993
1.186
+7.496
-118.8%
jan 1, 1994
2.097
+0.91
76.75%
jan 1, 1995
-0.072
-2.168
-103.42%
jan 1, 1996
1.712
+1.784
-2.49K%
jan 1, 1997
2.149
+0.437
25.51%
jan 1, 1998
3.693
+1.545
71.88%
jan 1, 1999
3.932
+0.239
6.47%
jan 1, 2000
4.659
+0.727
18.48%
jan 1, 2001
4.76
+0.101
2.17%
jan 1, 2002
6.018
+1.258
26.42%
jan 1, 2003
-12.674
-18.692
-310.6%
jan 1, 2004
9.785
+22.459
-177.21%
jan 1, 2005
5.257
-4.528
-46.27%
jan 1, 2006
4.603
-0.654
-12.44%
jan 1, 2007
5.023
+0.42
9.12%
jan 1, 2008
6.241
+1.218
24.25%
jan 1, 2009
7.129
+0.888
14.23%
jan 1, 2010
-4.014
-11.142
-156.31%
jan 1, 2011
0.263
+4.277
-106.56%
jan 1, 2012
1.454
+1.191
452.77%
jan 1, 2013
3.028
+1.573
108.16%
jan 1, 2014
2.255
-0.772
-25.51%
jan 1, 2015
3.316
+1.061
47.03%
jan 1, 2016
3.054
-0.262
-7.89%
Ranking of countries by current statistics by years


Comments: