29
/
en
AIzaSyAYiBZKx7MnpbEhh9jyipgxe19OcubqV5w
April 1, 2024
112244
Costa Rica
CRI
true
2
1
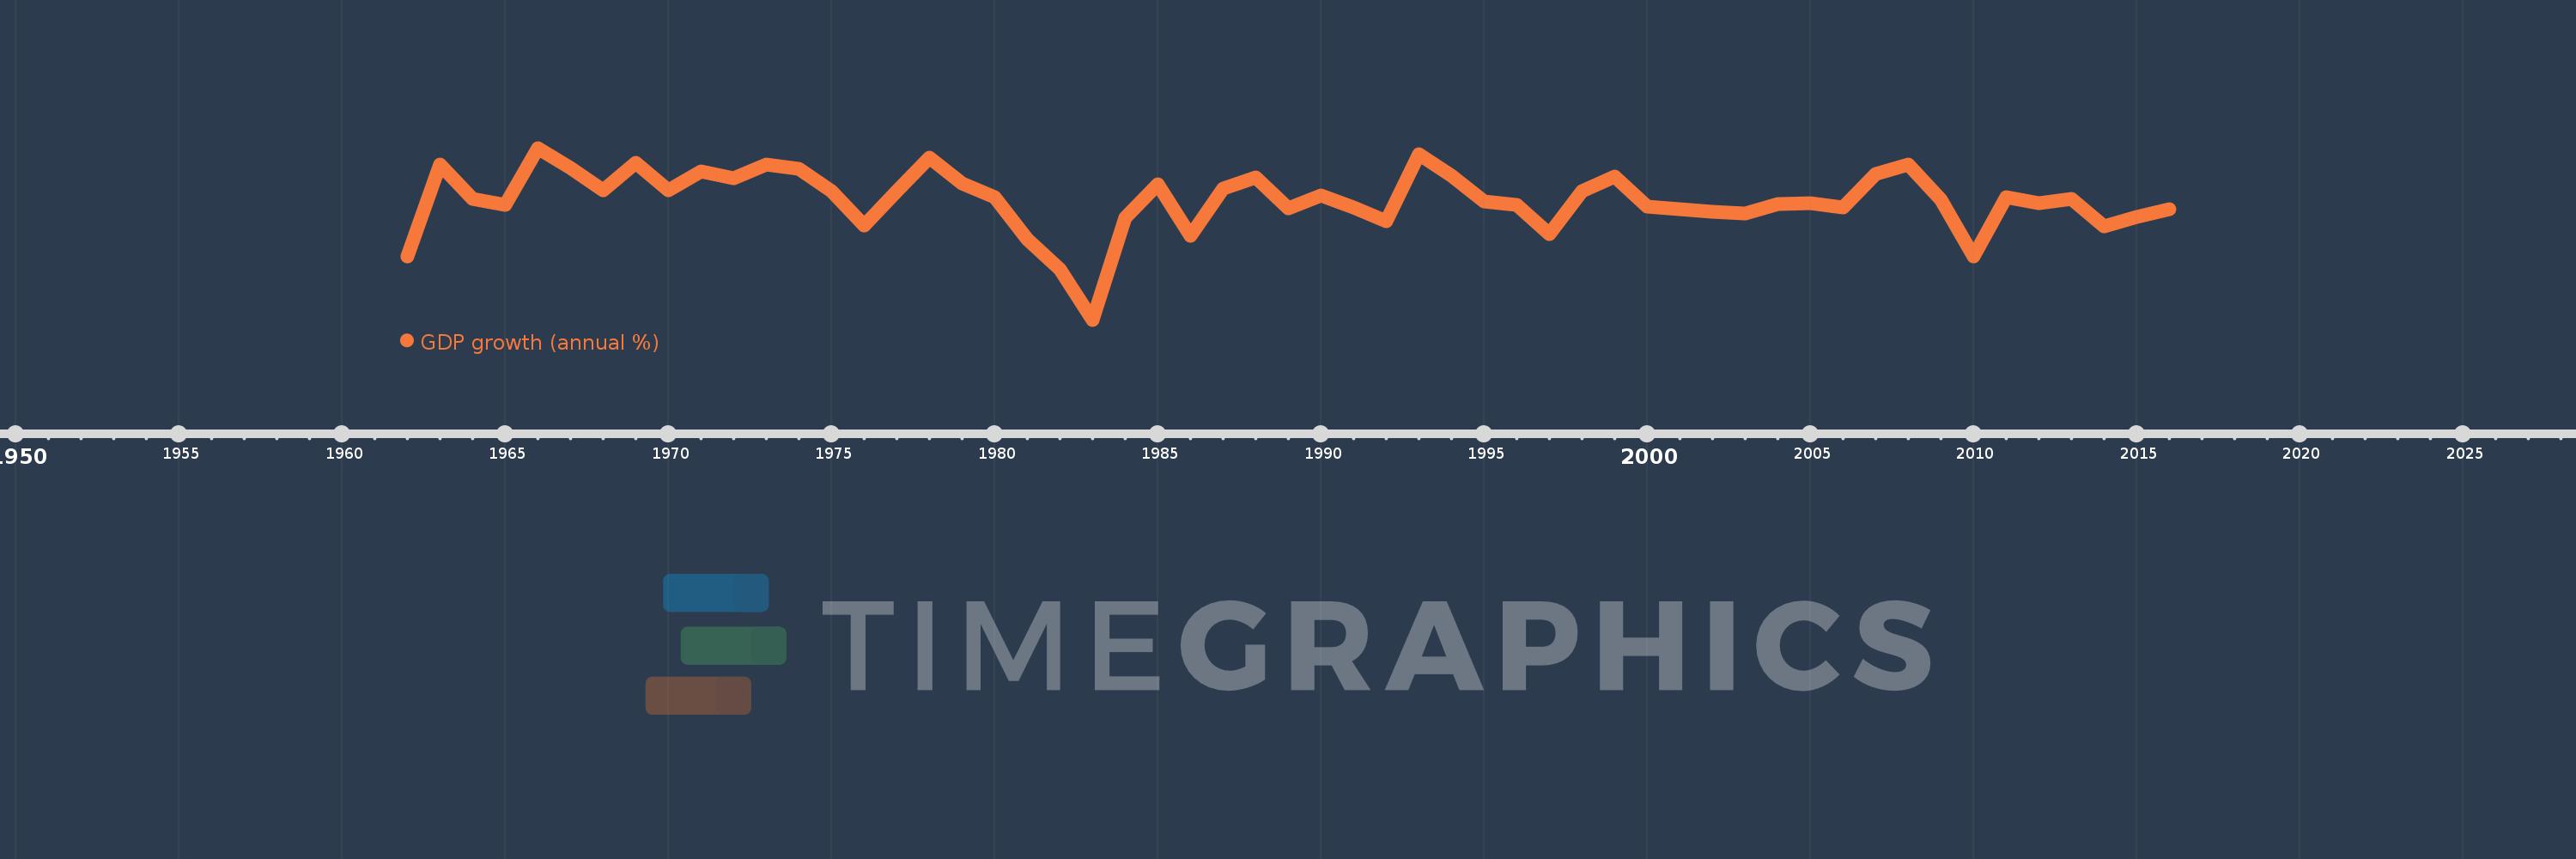
GDP growth (annual %)
2016,2015,2014,2013,2012,2011,2010,2009,2008,2007,2006,2005,2004,2003,2002,2001,2000,1999,1998,1997,1996,1995,1994,1993,1992,1991,1990,1989,1988,1987,1986,1985,1984,1983,1982,1981,1980,1979,1978,1977,1976,1975,1974,1973,1972,1971,1970,1969,1968,1967,1966,1965,1964,1963,1962
This statistics in other country:
AfghanistanAlbaniaAlgeriaAndorraAngolaAntigua and BarbudaArab WorldArgentinaArmeniaArubaAustraliaAustriaAzerbaijanBahamas, TheBahrainBangladeshBarbadosBelarusBelgiumBelizeBeninBermudaBhutanBoliviaBosnia and HerzegovinaBotswanaBrazilBrunei DarussalamBulgariaBurkina FasoBurundiCabo VerdeCambodiaCameroonCanadaCaribbean small statesCayman IslandsCentral African RepublicCentral Europe and the BalticsChadChannel IslandsChileChinaColombiaComorosCongo, Dem. Rep.Congo, Rep.Costa RicaCote d'IvoireCroatiaCubaCyprusCzech RepublicDenmarkDjiboutiDominicaDominican RepublicEarly-demographic dividendEast Asia & PacificEast Asia & Pacific (excluding high income)East Asia & Pacific (IDA & IBRD countries)EcuadorEgypt, Arab Rep.El SalvadorEquatorial GuineaEritreaEstoniaEthiopiaEuro areaEurope & Central AsiaEurope & Central Asia (excluding high income)Europe & Central Asia (IDA & IBRD countries)European UnionFijiFinlandFragile and conflict affected situationsFranceFrench PolynesiaGabonGambia, TheGeorgiaGermanyGhanaGreeceGreenlandGrenadaGuatemalaGuineaGuinea-BissauGuyanaHaitiHeavily indebted poor countries (HIPC)High incomeHondurasHong Kong SAR, ChinaHungaryIBRD onlyIcelandIDA & IBRD totalIDA blendIDA onlyIDA totalIndiaIndonesiaIran, Islamic Rep.IraqIrelandIsle of ManIsraelItalyJamaicaJapanJordanKazakhstanKenyaKiribatiKorea, Rep.KosovoKuwaitKyrgyz RepublicLao PDRLate-demographic dividendLatin America & Caribbean Latin America & Caribbean (excluding high income)Latin America & the Caribbean (IDA & IBRD countries)LatviaLeast developed countries: UN classificationLebanonLesothoLiberiaLibyaLiechtensteinLithuaniaLow & middle incomeLow incomeLower middle incomeLuxembourgMacao SAR, ChinaMacedonia, FYRMadagascarMalawiMalaysiaMaldivesMaliMaltaMarshall IslandsMauritaniaMauritiusMexicoMicronesia, Fed. Sts.Middle East & North AfricaMiddle East & North Africa (excluding high income)Middle East & North Africa (IDA & IBRD countries)Middle incomeMoldovaMonacoMongoliaMontenegroMoroccoMozambiqueMyanmarNamibiaNauruNepalNetherlandsNew CaledoniaNew ZealandNicaraguaNigerNigeriaNorth AmericaNorwayOECD membersOmanOther small statesPacific island small statesPakistanPalauPanamaPapua New GuineaParaguayPeruPhilippinesPolandPortugalPost-demographic dividendPre-demographic dividendPuerto RicoQatarRomaniaRussian FederationRwandaSamoaSan MarinoSao Tome and PrincipeSaudi ArabiaSenegalSerbiaSeychellesSierra LeoneSingaporeSlovak RepublicSloveniaSmall statesSolomon IslandsSomaliaSouth AfricaSouth AsiaSouth Asia (IDA & IBRD)South SudanSpainSri LankaSt. Kitts and NevisSt. LuciaSt. Vincent and the GrenadinesSub-Saharan Africa Sub-Saharan Africa (excluding high income)Sub-Saharan Africa (IDA & IBRD countries)SudanSurinameSwazilandSwedenSwitzerlandSyrian Arab RepublicTajikistanTanzaniaThailandTimor-LesteTogoTongaTrinidad and TobagoTunisiaTurkeyTurkmenistanTuvaluUgandaUkraineUnited Arab EmiratesUnited KingdomUnited StatesUpper middle incomeUruguayUzbekistanVanuatuVenezuela, RBVietnamVirgin Islands (U.S.)West Bank and GazaWorldYemen, Rep.ZambiaZimbabwe Timeline:
This timeline shows a graph from 1962 to 2016 of Costa Rica. No data until 1961. Number of actual observations by date: 55.
Source name:
World Development Indicators
Source organization:
World Bank national accounts data, and OECD National Accounts data files.
Categories, topics:
Economy & Growth
Last updated:
apr 23, 2017
Indicators value changes by year
Minimum:
-7.286
jan 1, 1983
At the date of observation
Value
Absolute change
Change from previous value
jan 1, 1962
-0.956
-0.956
0.0%
jan 1, 1963
8.148
+9.104
-952.39%
jan 1, 1964
4.785
-3.364
-41.28%
jan 1, 1965
4.149
-0.636
-13.29%
jan 1, 1966
9.83
+5.681
136.91%
jan 1, 1967
7.871
-1.959
-19.93%
jan 1, 1968
5.65
-2.221
-28.21%
jan 1, 1969
8.385
+2.735
48.4%
jan 1, 1970
5.578
-2.807
-33.48%
jan 1, 1971
7.503
+1.925
34.52%
jan 1, 1972
6.779
-0.725
-9.66%
jan 1, 1973
8.178
+1.4
20.65%
jan 1, 1974
7.709
-0.469
-5.74%
jan 1, 1975
5.545
-2.164
-28.07%
jan 1, 1976
2.1
-3.445
-62.13%
jan 1, 1977
5.518
+3.417
162.73%
jan 1, 1978
8.904
+3.387
61.38%
jan 1, 1979
6.268
-2.637
-29.61%
jan 1, 1980
4.939
-1.329
-21.2%
jan 1, 1981
0.752
-4.187
-84.78%
jan 1, 1982
-2.262
-3.014
-400.79%
jan 1, 1983
-7.286
-5.024
222.13%
jan 1, 1984
2.863
+10.149
-139.3%
jan 1, 1985
6.202
+3.339
116.62%
jan 1, 1986
1.041
-5.16
-83.21%
jan 1, 1987
5.785
+4.744
455.49%
jan 1, 1988
6.875
+1.09
18.85%
jan 1, 1989
3.819
-3.056
-44.45%
jan 1, 1990
5.066
+1.246
32.63%
jan 1, 1991
3.905
-1.161
-22.91%
jan 1, 1992
2.572
-1.333
-34.14%
jan 1, 1993
9.197
+6.625
257.58%
jan 1, 1994
7.088
-2.109
-22.93%
jan 1, 1995
4.487
-2.6
-36.69%
jan 1, 1996
4.121
-0.366
-8.15%
jan 1, 1997
1.238
-2.884
-69.97%
jan 1, 1998
5.565
+4.327
349.58%
jan 1, 1999
6.962
+1.397
25.1%
jan 1, 2000
3.943
-3.018
-43.36%
jan 1, 2001
3.735
-0.209
-5.3%
jan 1, 2002
3.49
-0.244
-6.54%
jan 1, 2003
3.292
-0.199
-5.69%
jan 1, 2004
4.255
+0.964
29.28%
jan 1, 2005
4.337
+0.081
1.91%
jan 1, 2006
3.871
-0.466
-10.74%
jan 1, 2007
7.238
+3.367
86.98%
jan 1, 2008
8.168
+0.93
12.85%
jan 1, 2009
4.65
-3.518
-43.07%
jan 1, 2010
-0.971
-5.62
-120.87%
jan 1, 2011
4.952
+5.922
-610.21%
jan 1, 2012
4.307
-0.645
-13.02%
jan 1, 2013
4.797
+0.49
11.37%
jan 1, 2014
2.048
-2.749
-57.31%
jan 1, 2015
2.975
+0.928
45.3%
jan 1, 2016
3.749
+0.774
26.01%
Ranking of countries by current statistics by years


Comments: