29
/
en
AIzaSyAYiBZKx7MnpbEhh9jyipgxe19OcubqV5w
April 1, 2024
161463
Italy
ITA
true
2
1
GDP growth (annual %)
2016,2015,2014,2013,2012,2011,2010,2009,2008,2007,2006,2005,2004,2003,2002,2001,2000,1999,1998,1997,1996,1995,1994,1993,1992,1991,1990,1989,1988,1987,1986,1985,1984,1983,1982,1981,1980,1979,1978,1977,1976,1975,1974,1973,1972,1971,1970,1969,1968,1967,1966,1965,1964,1963,1962
This statistics in other country:
AfghanistanAlbaniaAlgeriaAndorraAngolaAntigua and BarbudaArab WorldArgentinaArmeniaArubaAustraliaAustriaAzerbaijanBahamas, TheBahrainBangladeshBarbadosBelarusBelgiumBelizeBeninBermudaBhutanBoliviaBosnia and HerzegovinaBotswanaBrazilBrunei DarussalamBulgariaBurkina FasoBurundiCabo VerdeCambodiaCameroonCanadaCaribbean small statesCayman IslandsCentral African RepublicCentral Europe and the BalticsChadChannel IslandsChileChinaColombiaComorosCongo, Dem. Rep.Congo, Rep.Costa RicaCote d'IvoireCroatiaCubaCyprusCzech RepublicDenmarkDjiboutiDominicaDominican RepublicEarly-demographic dividendEast Asia & PacificEast Asia & Pacific (excluding high income)East Asia & Pacific (IDA & IBRD countries)EcuadorEgypt, Arab Rep.El SalvadorEquatorial GuineaEritreaEstoniaEthiopiaEuro areaEurope & Central AsiaEurope & Central Asia (excluding high income)Europe & Central Asia (IDA & IBRD countries)European UnionFijiFinlandFragile and conflict affected situationsFranceFrench PolynesiaGabonGambia, TheGeorgiaGermanyGhanaGreeceGreenlandGrenadaGuatemalaGuineaGuinea-BissauGuyanaHaitiHeavily indebted poor countries (HIPC)High incomeHondurasHong Kong SAR, ChinaHungaryIBRD onlyIcelandIDA & IBRD totalIDA blendIDA onlyIDA totalIndiaIndonesiaIran, Islamic Rep.IraqIrelandIsle of ManIsraelItalyJamaicaJapanJordanKazakhstanKenyaKiribatiKorea, Rep.KosovoKuwaitKyrgyz RepublicLao PDRLate-demographic dividendLatin America & Caribbean Latin America & Caribbean (excluding high income)Latin America & the Caribbean (IDA & IBRD countries)LatviaLeast developed countries: UN classificationLebanonLesothoLiberiaLibyaLiechtensteinLithuaniaLow & middle incomeLow incomeLower middle incomeLuxembourgMacao SAR, ChinaMacedonia, FYRMadagascarMalawiMalaysiaMaldivesMaliMaltaMarshall IslandsMauritaniaMauritiusMexicoMicronesia, Fed. Sts.Middle East & North AfricaMiddle East & North Africa (excluding high income)Middle East & North Africa (IDA & IBRD countries)Middle incomeMoldovaMonacoMongoliaMontenegroMoroccoMozambiqueMyanmarNamibiaNauruNepalNetherlandsNew CaledoniaNew ZealandNicaraguaNigerNigeriaNorth AmericaNorwayOECD membersOmanOther small statesPacific island small statesPakistanPalauPanamaPapua New GuineaParaguayPeruPhilippinesPolandPortugalPost-demographic dividendPre-demographic dividendPuerto RicoQatarRomaniaRussian FederationRwandaSamoaSan MarinoSao Tome and PrincipeSaudi ArabiaSenegalSerbiaSeychellesSierra LeoneSingaporeSlovak RepublicSloveniaSmall statesSolomon IslandsSomaliaSouth AfricaSouth AsiaSouth Asia (IDA & IBRD)South SudanSpainSri LankaSt. Kitts and NevisSt. LuciaSt. Vincent and the GrenadinesSub-Saharan Africa Sub-Saharan Africa (excluding high income)Sub-Saharan Africa (IDA & IBRD countries)SudanSurinameSwazilandSwedenSwitzerlandSyrian Arab RepublicTajikistanTanzaniaThailandTimor-LesteTogoTongaTrinidad and TobagoTunisiaTurkeyTurkmenistanTuvaluUgandaUkraineUnited Arab EmiratesUnited KingdomUnited StatesUpper middle incomeUruguayUzbekistanVanuatuVenezuela, RBVietnamVirgin Islands (U.S.)West Bank and GazaWorldYemen, Rep.ZambiaZimbabwe Timeline:
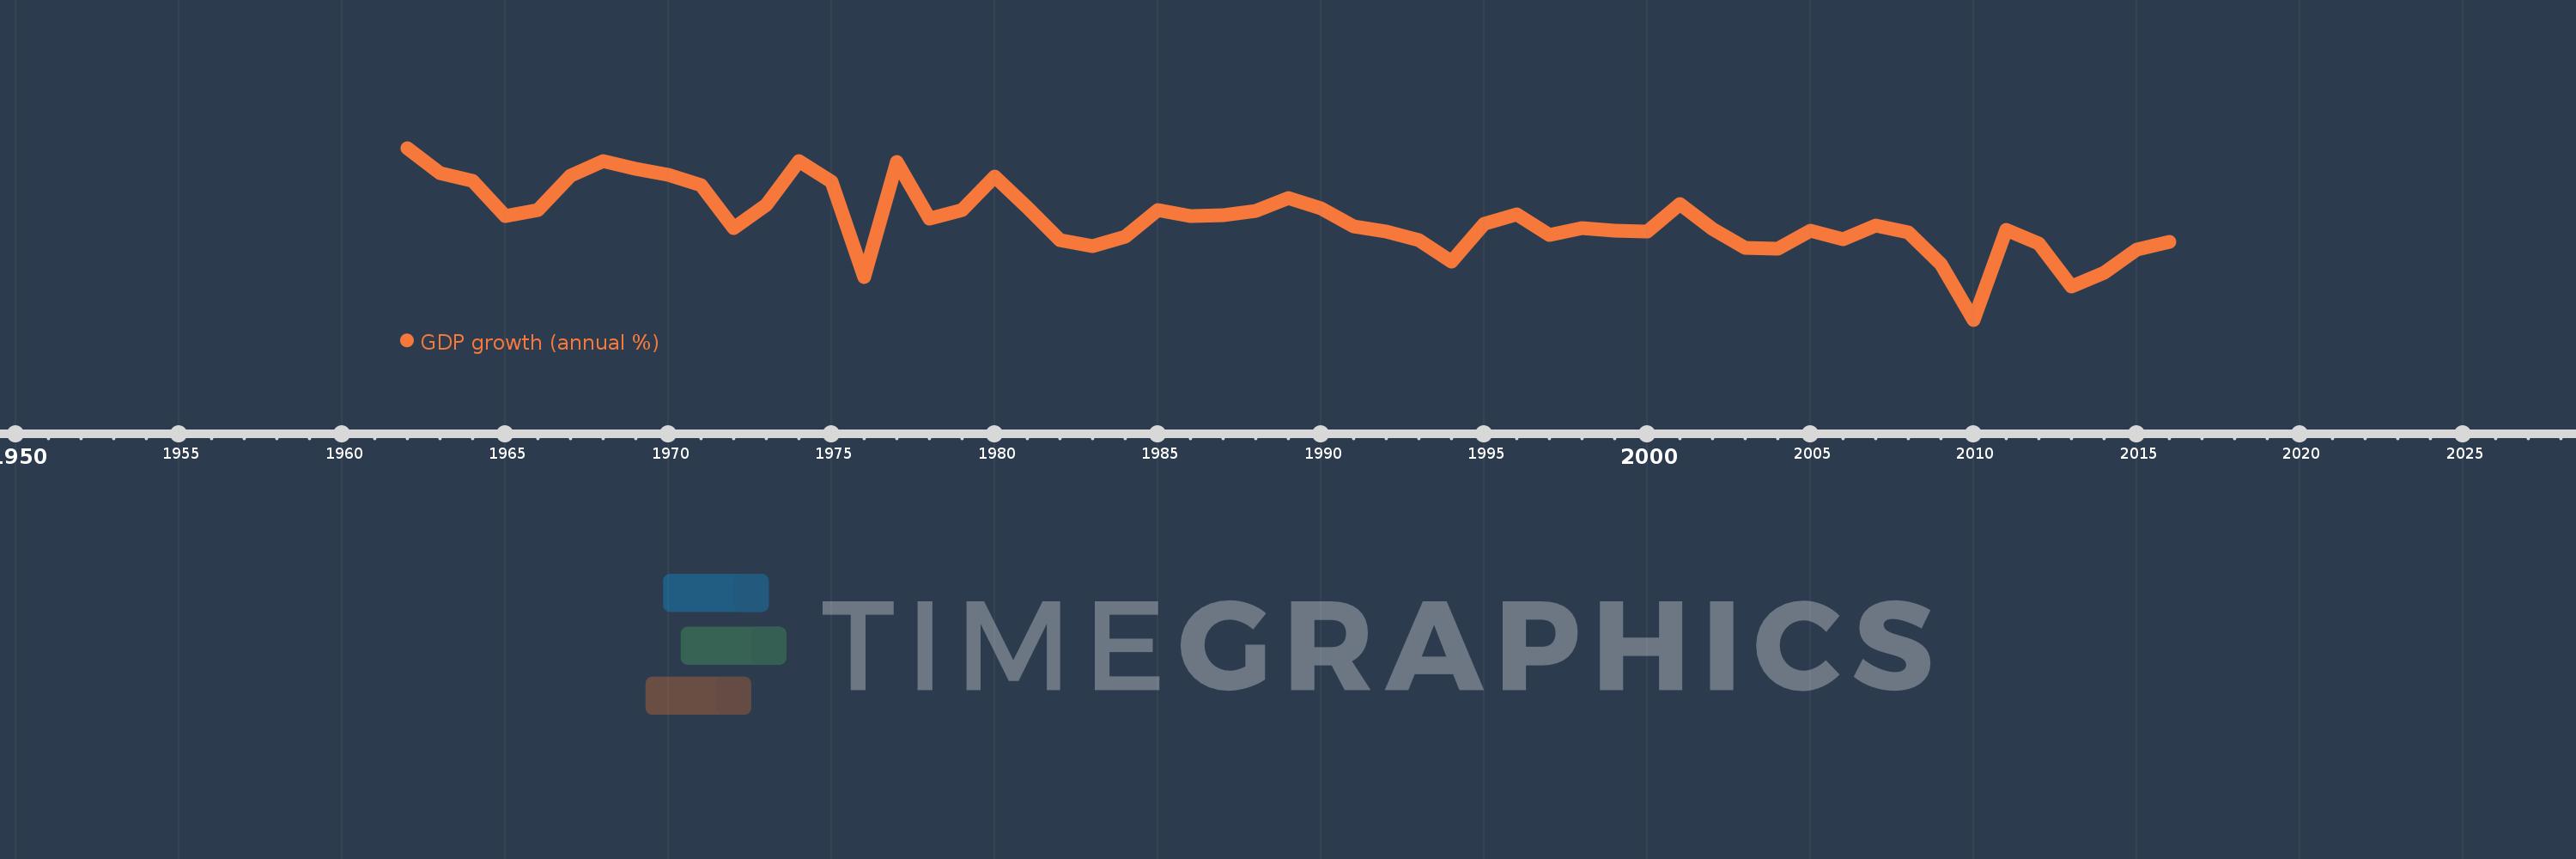
This timeline shows a graph from 1962 to 2016 of Italy. No data until 1961. Number of actual observations by date: 55.
Source name:
World Development Indicators
Source organization:
World Bank national accounts data, and OECD National Accounts data files.
Categories, topics:
Economy & Growth
Last updated:
apr 23, 2017
Indicators value changes by year
Minimum:
-5.482
jan 1, 2010
At the date of observation
Value
Absolute change
Change from previous value
jan 1, 1962
8.207
+8.207
0.0%
jan 1, 1963
6.204
-2.004
-24.41%
jan 1, 1964
5.61
-0.594
-9.57%
jan 1, 1965
2.798
-2.812
-50.13%
jan 1, 1966
3.268
+0.47
16.81%
jan 1, 1967
5.985
+2.717
83.13%
jan 1, 1968
7.179
+1.194
19.95%
jan 1, 1969
6.545
-0.634
-8.83%
jan 1, 1970
6.098
-0.446
-6.82%
jan 1, 1971
5.269
-0.829
-13.6%
jan 1, 1972
1.818
-3.451
-65.49%
jan 1, 1973
3.69
+1.872
102.98%
jan 1, 1974
7.126
+3.435
93.09%
jan 1, 1975
5.5
-1.626
-22.81%
jan 1, 1976
-2.09
-7.59
-138.0%
jan 1, 1977
7.125
+9.216
-440.9%
jan 1, 1978
2.561
-4.565
-64.07%
jan 1, 1979
3.24
+0.68
26.54%
jan 1, 1980
5.959
+2.719
83.92%
jan 1, 1981
3.43
-2.529
-42.44%
jan 1, 1982
0.844
-2.586
-75.39%
jan 1, 1983
0.414
-0.431
-51.01%
jan 1, 1984
1.169
+0.756
182.7%
jan 1, 1985
3.226
+2.057
175.9%
jan 1, 1986
2.798
-0.428
-13.26%
jan 1, 1987
2.86
+0.062
2.21%
jan 1, 1988
3.192
+0.332
11.61%
jan 1, 1989
4.194
+1.002
31.4%
jan 1, 1990
3.388
-0.806
-19.22%
jan 1, 1991
1.986
-1.403
-41.39%
jan 1, 1992
1.538
-0.447
-22.53%
jan 1, 1993
0.834
-0.704
-45.77%
jan 1, 1994
-0.853
-1.687
-202.22%
jan 1, 1995
2.151
+3.004
-352.23%
jan 1, 1996
2.887
+0.736
34.21%
jan 1, 1997
1.286
-1.6
-55.44%
jan 1, 1998
1.835
+0.549
42.68%
jan 1, 1999
1.616
-0.219
-11.95%
jan 1, 2000
1.56
-0.056
-3.48%
jan 1, 2001
3.71
+2.15
137.85%
jan 1, 2002
1.772
-1.938
-52.23%
jan 1, 2003
0.249
-1.524
-85.98%
jan 1, 2004
0.151
-0.097
-39.12%
jan 1, 2005
1.582
+1.431
945.4%
jan 1, 2006
0.95
-0.632
-39.97%
jan 1, 2007
2.007
+1.057
111.29%
jan 1, 2008
1.474
-0.533
-26.55%
jan 1, 2009
-1.05
-2.524
-171.27%
jan 1, 2010
-5.482
-4.432
421.9%
jan 1, 2011
1.687
+7.169
-130.76%
jan 1, 2012
0.577
-1.11
-65.81%
jan 1, 2013
-2.819
-3.396
-588.88%
jan 1, 2014
-1.728
+1.091
-38.7%
jan 1, 2015
0.092
+1.82
-105.32%
jan 1, 2016
0.732
+0.64
696.27%
Ranking of countries by current statistics by years


Comments: