29
/
en
AIzaSyAYiBZKx7MnpbEhh9jyipgxe19OcubqV5w
April 1, 2024
141804
Greece
GRC
true
2
1
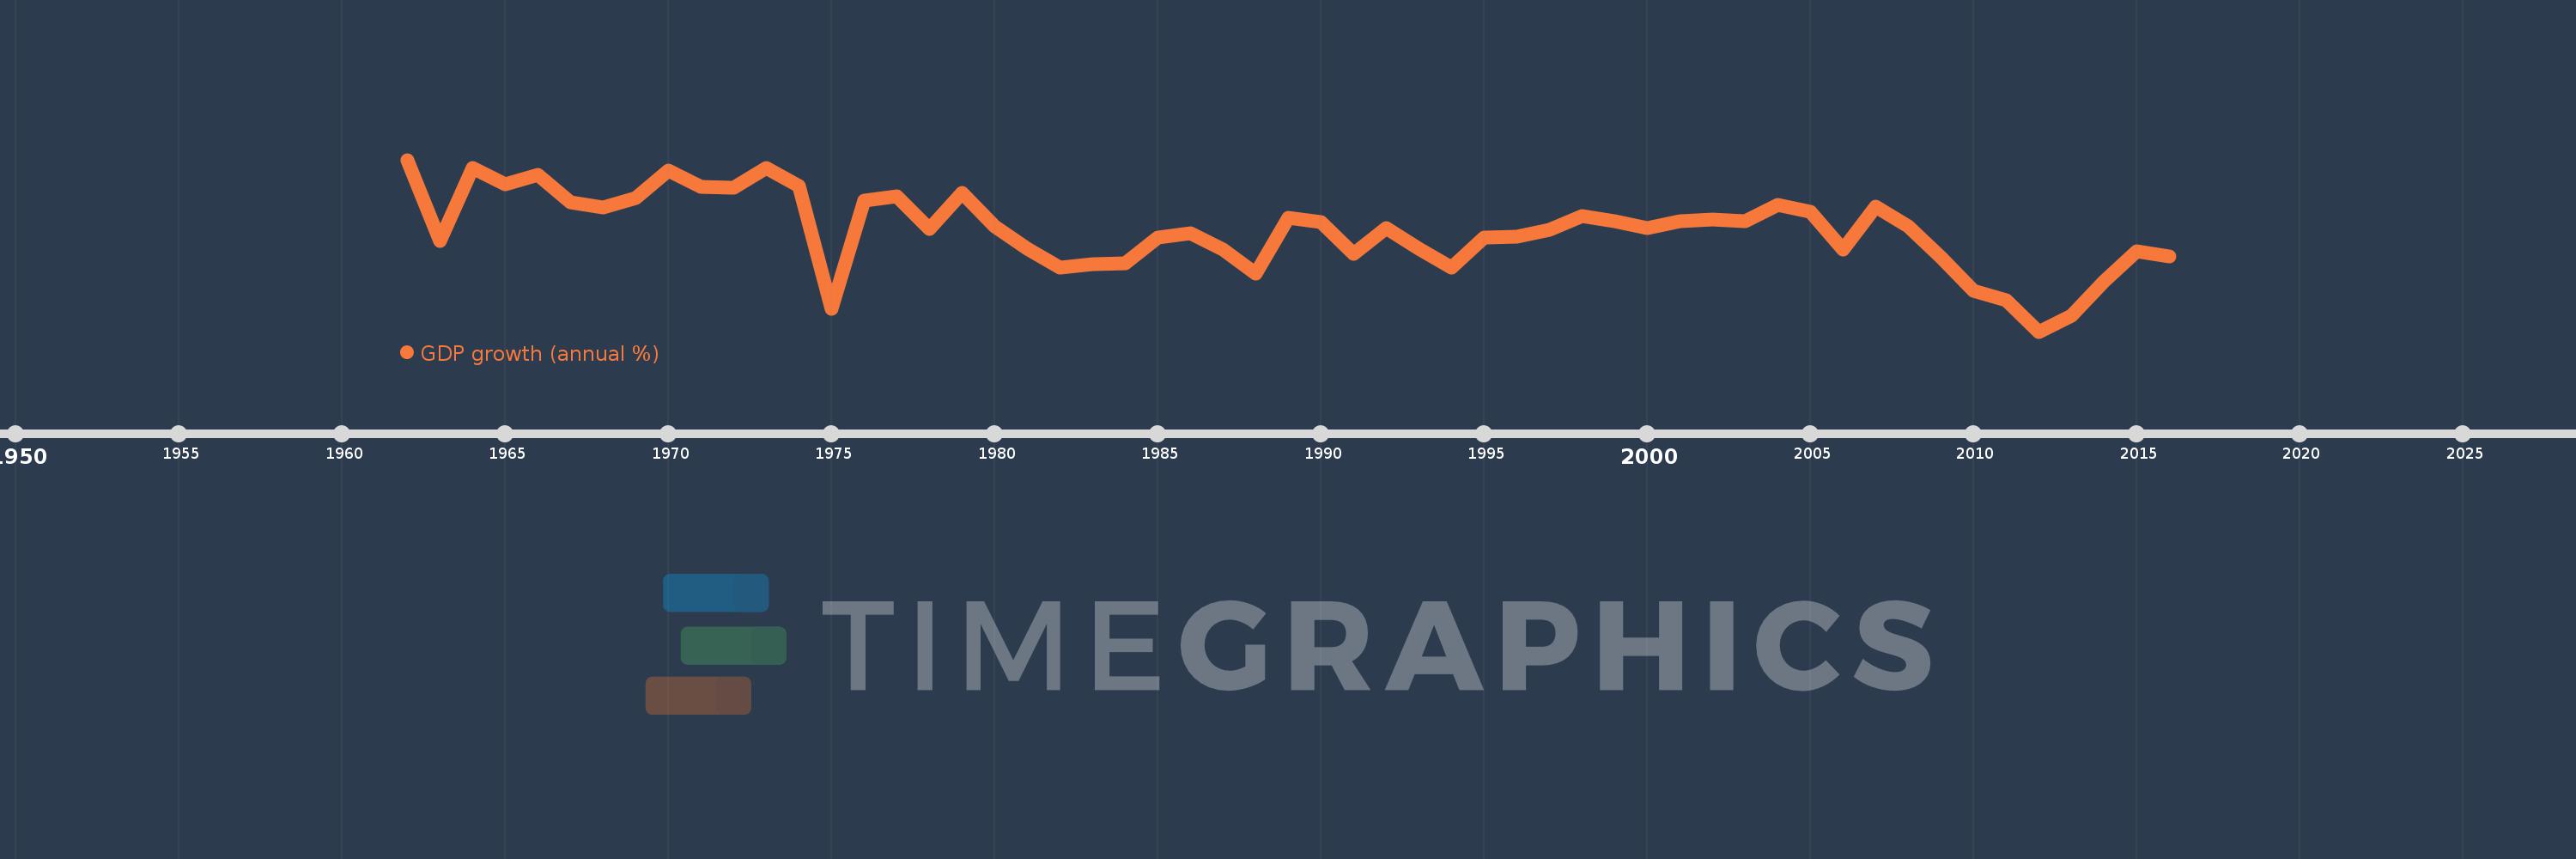
GDP growth (annual %)
2016,2015,2014,2013,2012,2011,2010,2009,2008,2007,2006,2005,2004,2003,2002,2001,2000,1999,1998,1997,1996,1995,1994,1993,1992,1991,1990,1989,1988,1987,1986,1985,1984,1983,1982,1981,1980,1979,1978,1977,1976,1975,1974,1973,1972,1971,1970,1969,1968,1967,1966,1965,1964,1963,1962
This statistics in other country:
AfghanistanAlbaniaAlgeriaAndorraAngolaAntigua and BarbudaArab WorldArgentinaArmeniaArubaAustraliaAustriaAzerbaijanBahamas, TheBahrainBangladeshBarbadosBelarusBelgiumBelizeBeninBermudaBhutanBoliviaBosnia and HerzegovinaBotswanaBrazilBrunei DarussalamBulgariaBurkina FasoBurundiCabo VerdeCambodiaCameroonCanadaCaribbean small statesCayman IslandsCentral African RepublicCentral Europe and the BalticsChadChannel IslandsChileChinaColombiaComorosCongo, Dem. Rep.Congo, Rep.Costa RicaCote d'IvoireCroatiaCubaCyprusCzech RepublicDenmarkDjiboutiDominicaDominican RepublicEarly-demographic dividendEast Asia & PacificEast Asia & Pacific (excluding high income)East Asia & Pacific (IDA & IBRD countries)EcuadorEgypt, Arab Rep.El SalvadorEquatorial GuineaEritreaEstoniaEthiopiaEuro areaEurope & Central AsiaEurope & Central Asia (excluding high income)Europe & Central Asia (IDA & IBRD countries)European UnionFijiFinlandFragile and conflict affected situationsFranceFrench PolynesiaGabonGambia, TheGeorgiaGermanyGhanaGreeceGreenlandGrenadaGuatemalaGuineaGuinea-BissauGuyanaHaitiHeavily indebted poor countries (HIPC)High incomeHondurasHong Kong SAR, ChinaHungaryIBRD onlyIcelandIDA & IBRD totalIDA blendIDA onlyIDA totalIndiaIndonesiaIran, Islamic Rep.IraqIrelandIsle of ManIsraelItalyJamaicaJapanJordanKazakhstanKenyaKiribatiKorea, Rep.KosovoKuwaitKyrgyz RepublicLao PDRLate-demographic dividendLatin America & Caribbean Latin America & Caribbean (excluding high income)Latin America & the Caribbean (IDA & IBRD countries)LatviaLeast developed countries: UN classificationLebanonLesothoLiberiaLibyaLiechtensteinLithuaniaLow & middle incomeLow incomeLower middle incomeLuxembourgMacao SAR, ChinaMacedonia, FYRMadagascarMalawiMalaysiaMaldivesMaliMaltaMarshall IslandsMauritaniaMauritiusMexicoMicronesia, Fed. Sts.Middle East & North AfricaMiddle East & North Africa (excluding high income)Middle East & North Africa (IDA & IBRD countries)Middle incomeMoldovaMonacoMongoliaMontenegroMoroccoMozambiqueMyanmarNamibiaNauruNepalNetherlandsNew CaledoniaNew ZealandNicaraguaNigerNigeriaNorth AmericaNorwayOECD membersOmanOther small statesPacific island small statesPakistanPalauPanamaPapua New GuineaParaguayPeruPhilippinesPolandPortugalPost-demographic dividendPre-demographic dividendPuerto RicoQatarRomaniaRussian FederationRwandaSamoaSan MarinoSao Tome and PrincipeSaudi ArabiaSenegalSerbiaSeychellesSierra LeoneSingaporeSlovak RepublicSloveniaSmall statesSolomon IslandsSomaliaSouth AfricaSouth AsiaSouth Asia (IDA & IBRD)South SudanSpainSri LankaSt. Kitts and NevisSt. LuciaSt. Vincent and the GrenadinesSub-Saharan Africa Sub-Saharan Africa (excluding high income)Sub-Saharan Africa (IDA & IBRD countries)SudanSurinameSwazilandSwedenSwitzerlandSyrian Arab RepublicTajikistanTanzaniaThailandTimor-LesteTogoTongaTrinidad and TobagoTunisiaTurkeyTurkmenistanTuvaluUgandaUkraineUnited Arab EmiratesUnited KingdomUnited StatesUpper middle incomeUruguayUzbekistanVanuatuVenezuela, RBVietnamVirgin Islands (U.S.)West Bank and GazaWorldYemen, Rep.ZambiaZimbabwe Timeline:
This timeline shows a graph from 1962 to 2016 of Greece. No data until 1961. Number of actual observations by date: 55.
Source name:
World Development Indicators
Source organization:
World Bank national accounts data, and OECD National Accounts data files.
Categories, topics:
Economy & Growth
Last updated:
apr 23, 2017
Indicators value changes by year
Minimum:
-9.132
jan 1, 2012
At the date of observation
Value
Absolute change
Change from previous value
jan 1, 1962
11.15
+11.15
0.0%
jan 1, 1963
1.534
-9.616
-86.25%
jan 1, 1964
10.136
+8.603
560.97%
jan 1, 1965
8.258
-1.878
-18.53%
jan 1, 1966
9.393
+1.134
13.74%
jan 1, 1967
6.099
-3.294
-35.07%
jan 1, 1968
5.481
-0.617
-10.12%
jan 1, 1969
6.664
+1.183
21.58%
jan 1, 1970
9.9
+3.236
48.55%
jan 1, 1971
7.951
-1.948
-19.68%
jan 1, 1972
7.841
-0.11
-1.38%
jan 1, 1973
10.16
+2.319
29.57%
jan 1, 1974
8.092
-2.068
-20.35%
jan 1, 1975
-6.438
-14.531
-179.56%
jan 1, 1976
6.367
+12.805
-198.89%
jan 1, 1977
6.852
+0.485
7.62%
jan 1, 1978
2.941
-3.911
-57.08%
jan 1, 1979
7.247
+4.306
146.41%
jan 1, 1980
3.282
-3.965
-54.71%
jan 1, 1981
0.677
-2.605
-79.37%
jan 1, 1982
-1.554
-2.231
-329.46%
jan 1, 1983
-1.133
+0.421
-27.1%
jan 1, 1984
-1.079
+0.054
-4.77%
jan 1, 1985
2.011
+3.089
-286.4%
jan 1, 1986
2.51
+0.499
24.82%
jan 1, 1987
0.518
-1.992
-79.37%
jan 1, 1988
-2.259
-2.777
-536.36%
jan 1, 1989
4.288
+6.547
-289.82%
jan 1, 1990
3.8
-0.488
-11.38%
jan 1, 1991
0.0
-3.8
-100.0%
jan 1, 1993
0.7
-2.4
-77.42%
jan 1, 1994
-1.6
-2.3
-328.57%
jan 1, 1995
2.0
+3.6
-225.0%
jan 1, 1996
2.1
+0.1
4.99%
jan 1, 1997
2.862
+0.762
36.31%
jan 1, 1998
4.484
+1.622
56.67%
jan 1, 1999
3.895
-0.589
-13.14%
jan 1, 2000
3.073
-0.822
-21.11%
jan 1, 2001
3.92
+0.847
27.57%
jan 1, 2002
4.132
+0.212
5.4%
jan 1, 2003
3.923
-0.209
-5.05%
jan 1, 2004
5.795
+1.872
47.71%
jan 1, 2005
5.061
-0.734
-12.66%
jan 1, 2006
0.599
-4.462
-88.16%
jan 1, 2007
5.652
+5.053
843.42%
jan 1, 2008
3.274
-2.379
-42.08%
jan 1, 2009
-0.335
-3.609
-110.24%
jan 1, 2010
-4.301
-3.966
1.18K%
jan 1, 2011
-5.479
-1.178
27.4%
jan 1, 2012
-9.132
-3.653
66.68%
jan 1, 2013
-7.3
+1.832
-20.06%
jan 1, 2014
-3.241
+4.059
-55.6%
jan 1, 2015
0.353
+3.594
-110.89%
jan 1, 2016
-0.219
-0.572
-162.11%
Ranking of countries by current statistics by years


Comments: