29
/
en
AIzaSyAYiBZKx7MnpbEhh9jyipgxe19OcubqV5w
April 1, 2024
29085
East Asia & Pacific (IDA & IBRD countries)
TEA
false
2
1
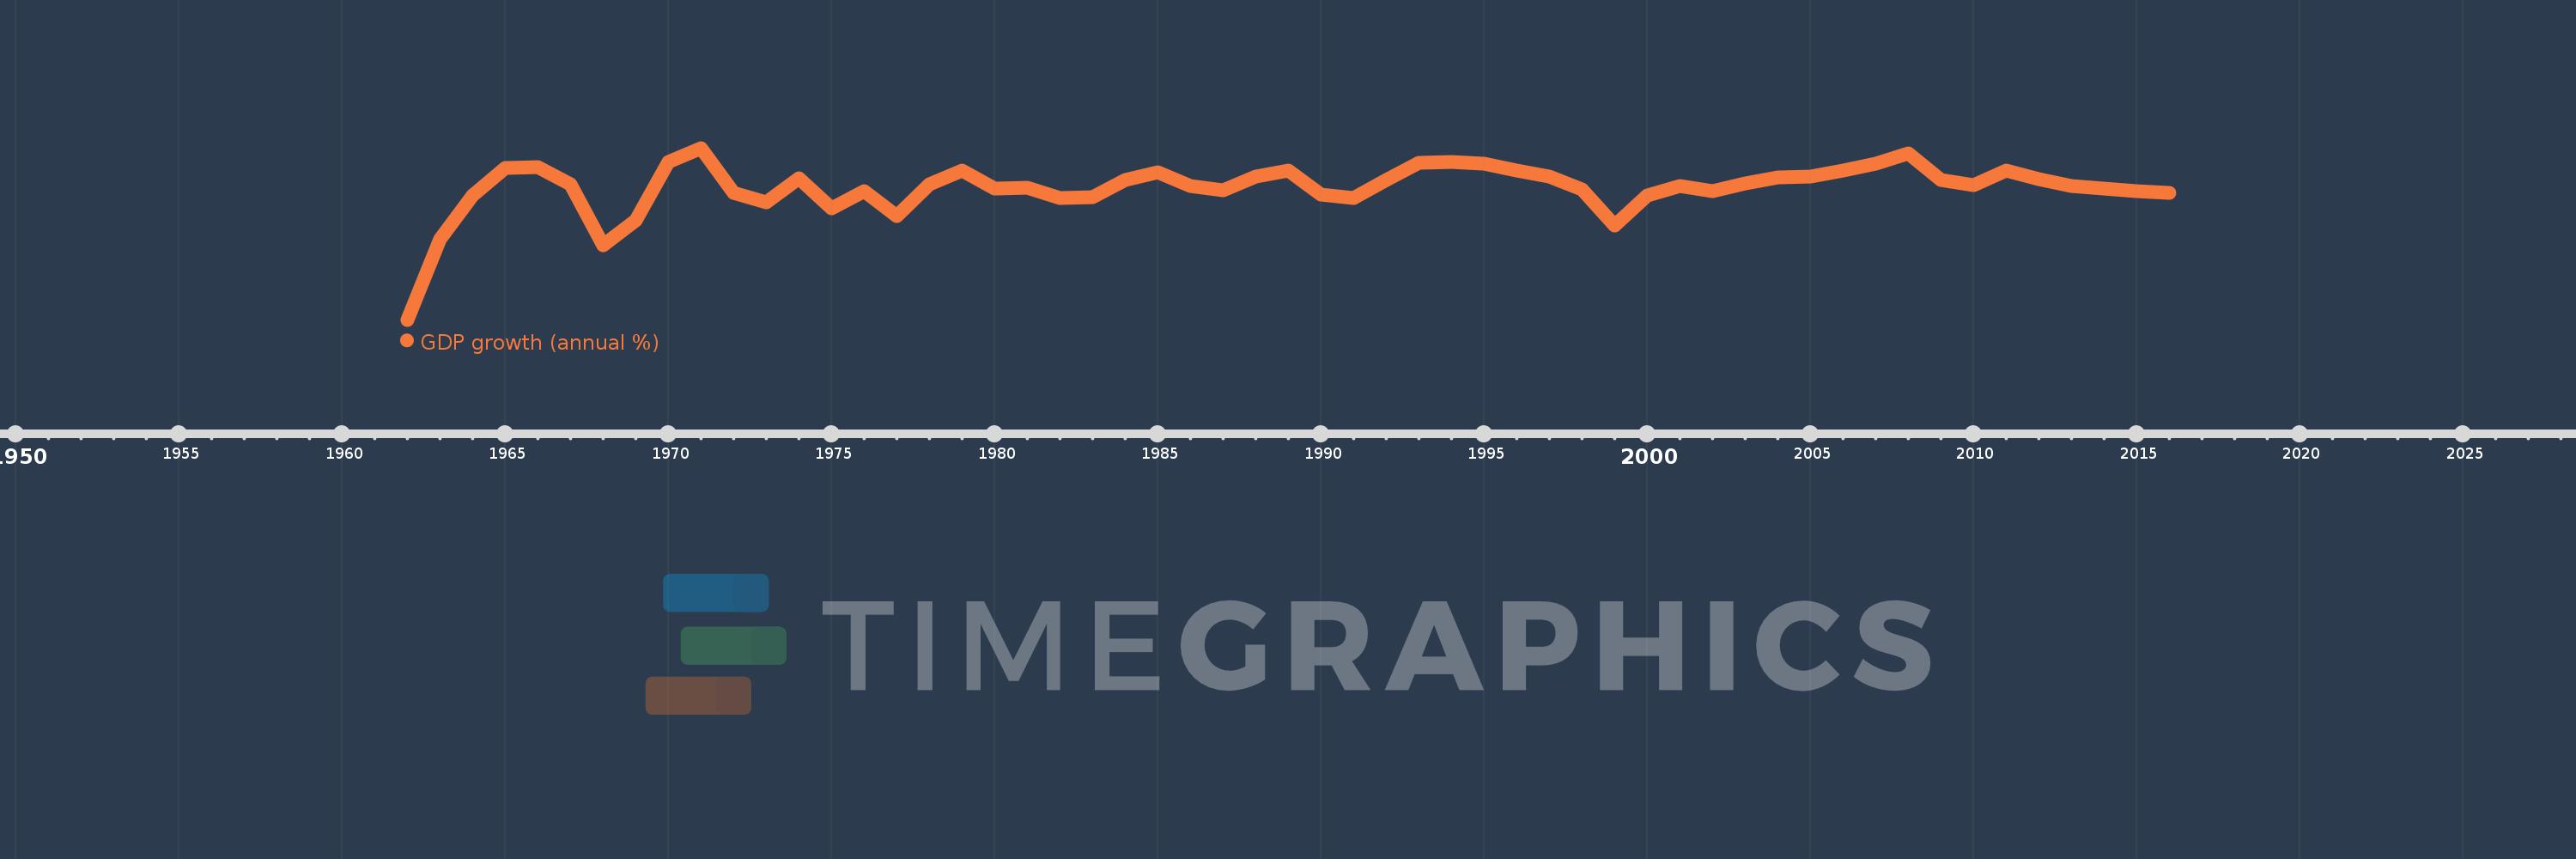
GDP growth (annual %)
2016,2015,2014,2013,2012,2011,2010,2009,2008,2007,2006,2005,2004,2003,2002,2001,2000,1999,1998,1997,1996,1995,1994,1993,1992,1991,1990,1989,1988,1987,1986,1985,1984,1983,1982,1981,1980,1979,1978,1977,1976,1975,1974,1973,1972,1971,1970,1969,1968,1967,1966,1965,1964,1963,1962
This statistics in other country:
AfghanistanAlbaniaAlgeriaAndorraAngolaAntigua and BarbudaArab WorldArgentinaArmeniaArubaAustraliaAustriaAzerbaijanBahamas, TheBahrainBangladeshBarbadosBelarusBelgiumBelizeBeninBermudaBhutanBoliviaBosnia and HerzegovinaBotswanaBrazilBrunei DarussalamBulgariaBurkina FasoBurundiCabo VerdeCambodiaCameroonCanadaCaribbean small statesCayman IslandsCentral African RepublicCentral Europe and the BalticsChadChannel IslandsChileChinaColombiaComorosCongo, Dem. Rep.Congo, Rep.Costa RicaCote d'IvoireCroatiaCubaCyprusCzech RepublicDenmarkDjiboutiDominicaDominican RepublicEarly-demographic dividendEast Asia & PacificEast Asia & Pacific (excluding high income)East Asia & Pacific (IDA & IBRD countries)EcuadorEgypt, Arab Rep.El SalvadorEquatorial GuineaEritreaEstoniaEthiopiaEuro areaEurope & Central AsiaEurope & Central Asia (excluding high income)Europe & Central Asia (IDA & IBRD countries)European UnionFijiFinlandFragile and conflict affected situationsFranceFrench PolynesiaGabonGambia, TheGeorgiaGermanyGhanaGreeceGreenlandGrenadaGuatemalaGuineaGuinea-BissauGuyanaHaitiHeavily indebted poor countries (HIPC)High incomeHondurasHong Kong SAR, ChinaHungaryIBRD onlyIcelandIDA & IBRD totalIDA blendIDA onlyIDA totalIndiaIndonesiaIran, Islamic Rep.IraqIrelandIsle of ManIsraelItalyJamaicaJapanJordanKazakhstanKenyaKiribatiKorea, Rep.KosovoKuwaitKyrgyz RepublicLao PDRLate-demographic dividendLatin America & Caribbean Latin America & Caribbean (excluding high income)Latin America & the Caribbean (IDA & IBRD countries)LatviaLeast developed countries: UN classificationLebanonLesothoLiberiaLibyaLiechtensteinLithuaniaLow & middle incomeLow incomeLower middle incomeLuxembourgMacao SAR, ChinaMacedonia, FYRMadagascarMalawiMalaysiaMaldivesMaliMaltaMarshall IslandsMauritaniaMauritiusMexicoMicronesia, Fed. Sts.Middle East & North AfricaMiddle East & North Africa (excluding high income)Middle East & North Africa (IDA & IBRD countries)Middle incomeMoldovaMonacoMongoliaMontenegroMoroccoMozambiqueMyanmarNamibiaNauruNepalNetherlandsNew CaledoniaNew ZealandNicaraguaNigerNigeriaNorth AmericaNorwayOECD membersOmanOther small statesPacific island small statesPakistanPalauPanamaPapua New GuineaParaguayPeruPhilippinesPolandPortugalPost-demographic dividendPre-demographic dividendPuerto RicoQatarRomaniaRussian FederationRwandaSamoaSan MarinoSao Tome and PrincipeSaudi ArabiaSenegalSerbiaSeychellesSierra LeoneSingaporeSlovak RepublicSloveniaSmall statesSolomon IslandsSomaliaSouth AfricaSouth AsiaSouth Asia (IDA & IBRD)South SudanSpainSri LankaSt. Kitts and NevisSt. LuciaSt. Vincent and the GrenadinesSub-Saharan Africa Sub-Saharan Africa (excluding high income)Sub-Saharan Africa (IDA & IBRD countries)SudanSurinameSwazilandSwedenSwitzerlandSyrian Arab RepublicTajikistanTanzaniaThailandTimor-LesteTogoTongaTrinidad and TobagoTunisiaTurkeyTurkmenistanTuvaluUgandaUkraineUnited Arab EmiratesUnited KingdomUnited StatesUpper middle incomeUruguayUzbekistanVanuatuVenezuela, RBVietnamVirgin Islands (U.S.)West Bank and GazaWorldYemen, Rep.ZambiaZimbabwe Timeline:
This timeline shows a graph from 1962 to 2016 of East Asia & Pacific (IDA & IBRD countries). No data until 1961. Number of actual observations by date: 55.
Source name:
World Development Indicators
Source organization:
World Bank national accounts data, and OECD National Accounts data files.
Categories, topics:
Economy & Growth
Last updated:
apr 23, 2017
Indicators value changes by year
Minimum:
-11.867
jan 1, 1962
Maximum:
13.044
jan 1, 1971
At the date of observation
Value
Absolute change
Change from previous value
jan 1, 1962
-11.867
-11.867
0.0%
jan 1, 1963
-0.216
+11.651
-98.18%
jan 1, 1964
6.16
+6.376
-2.95K%
jan 1, 1965
10.135
+3.975
64.53%
jan 1, 1966
10.218
+0.083
0.82%
jan 1, 1967
7.78
-2.438
-23.86%
jan 1, 1968
-1.079
-8.859
-113.87%
jan 1, 1969
2.579
+3.658
-338.99%
jan 1, 1970
11.031
+8.452
327.72%
jan 1, 1971
13.044
+2.014
18.25%
jan 1, 1972
6.53
-6.514
-49.94%
jan 1, 1973
5.214
-1.316
-20.16%
jan 1, 1974
8.687
+3.473
66.62%
jan 1, 1975
4.335
-4.352
-50.1%
jan 1, 1976
6.788
+2.454
56.6%
jan 1, 1977
3.139
-3.65
-53.77%
jan 1, 1978
7.721
+4.582
146.0%
jan 1, 1979
9.752
+2.032
26.31%
jan 1, 1980
7.097
-2.656
-27.23%
jan 1, 1981
7.332
+0.235
3.31%
jan 1, 1982
5.82
-1.511
-20.61%
jan 1, 1983
5.881
+0.061
1.05%
jan 1, 1984
8.395
+2.514
42.75%
jan 1, 1985
9.552
+1.157
13.78%
jan 1, 1986
7.517
-2.035
-21.3%
jan 1, 1987
6.963
-0.555
-7.38%
jan 1, 1988
8.948
+1.985
28.51%
jan 1, 1989
9.711
+0.762
8.52%
jan 1, 1990
6.229
-3.481
-35.85%
jan 1, 1991
5.742
-0.487
-7.82%
jan 1, 1992
8.347
+2.605
45.36%
jan 1, 1993
10.915
+2.568
30.77%
jan 1, 1994
11.032
+0.117
1.07%
jan 1, 1995
10.77
-0.262
-2.37%
jan 1, 1996
9.774
-0.996
-9.25%
jan 1, 1997
8.911
-0.863
-8.83%
jan 1, 1998
7.048
-1.863
-20.91%
jan 1, 1999
1.762
-5.286
-75.0%
jan 1, 2000
6.116
+4.354
247.07%
jan 1, 2001
7.514
+1.399
22.87%
jan 1, 2002
6.717
-0.798
-10.61%
jan 1, 2003
7.867
+1.15
17.12%
jan 1, 2004
8.732
+0.865
11.0%
jan 1, 2005
8.926
+0.195
2.23%
jan 1, 2006
9.709
+0.783
8.77%
jan 1, 2007
10.765
+1.055
10.87%
jan 1, 2008
12.288
+1.523
14.15%
jan 1, 2009
8.388
-3.901
-31.74%
jan 1, 2010
7.663
-0.725
-8.64%
jan 1, 2011
9.766
+2.104
27.45%
jan 1, 2012
8.474
-1.292
-13.23%
jan 1, 2013
7.514
-0.96
-11.33%
jan 1, 2014
7.208
-0.307
-4.08%
jan 1, 2015
6.761
-0.447
-6.2%
jan 1, 2016
6.485
-0.276
-4.09%
Ranking of countries by current statistics by years


Comments: