29
/
en
AIzaSyAYiBZKx7MnpbEhh9jyipgxe19OcubqV5w
April 1, 2024
105980
China
CHN
true
2
1
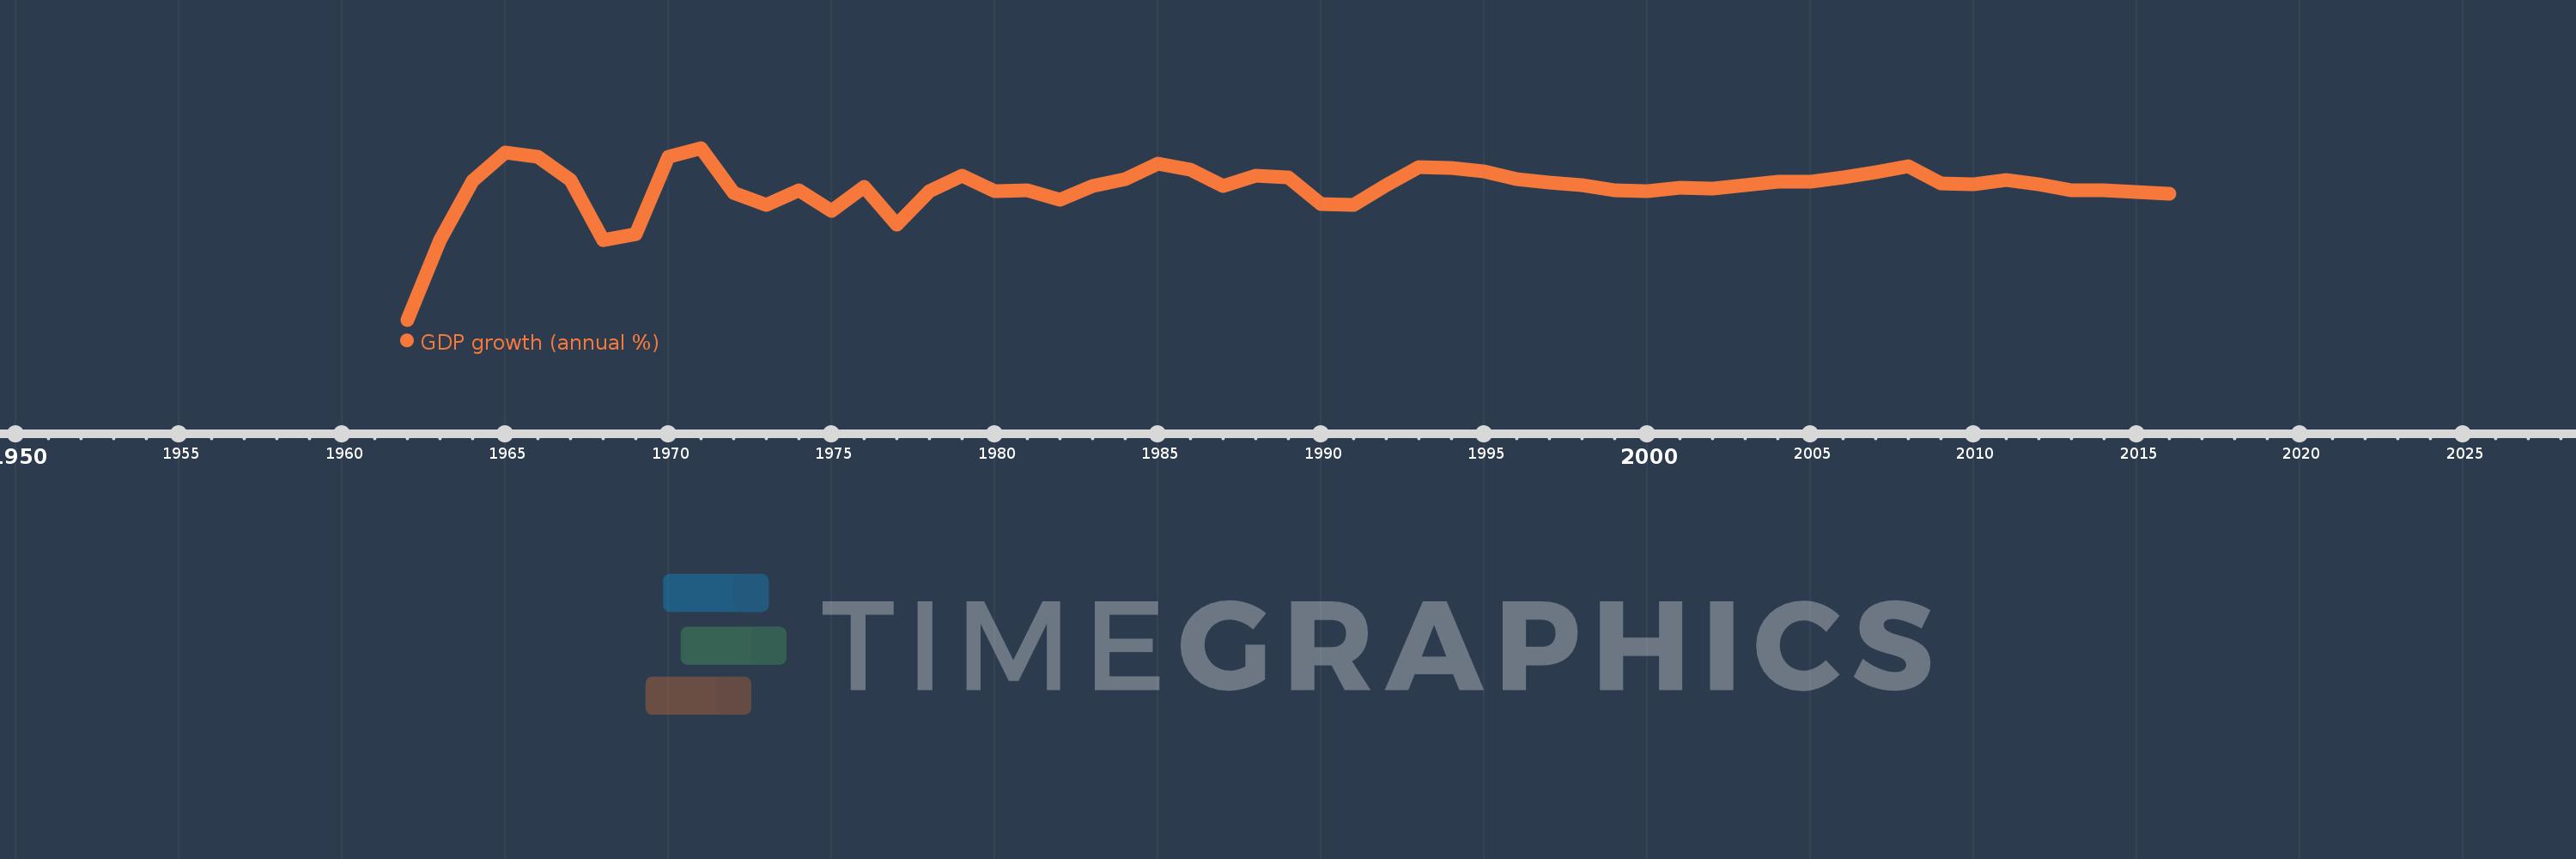
GDP growth (annual %)
2016,2015,2014,2013,2012,2011,2010,2009,2008,2007,2006,2005,2004,2003,2002,2001,2000,1999,1998,1997,1996,1995,1994,1993,1992,1991,1990,1989,1988,1987,1986,1985,1984,1983,1982,1981,1980,1979,1978,1977,1976,1975,1974,1973,1972,1971,1970,1969,1968,1967,1966,1965,1964,1963,1962
This statistics in other country:
AfghanistanAlbaniaAlgeriaAndorraAngolaAntigua and BarbudaArab WorldArgentinaArmeniaArubaAustraliaAustriaAzerbaijanBahamas, TheBahrainBangladeshBarbadosBelarusBelgiumBelizeBeninBermudaBhutanBoliviaBosnia and HerzegovinaBotswanaBrazilBrunei DarussalamBulgariaBurkina FasoBurundiCabo VerdeCambodiaCameroonCanadaCaribbean small statesCayman IslandsCentral African RepublicCentral Europe and the BalticsChadChannel IslandsChileChinaColombiaComorosCongo, Dem. Rep.Congo, Rep.Costa RicaCote d'IvoireCroatiaCubaCyprusCzech RepublicDenmarkDjiboutiDominicaDominican RepublicEarly-demographic dividendEast Asia & PacificEast Asia & Pacific (excluding high income)East Asia & Pacific (IDA & IBRD countries)EcuadorEgypt, Arab Rep.El SalvadorEquatorial GuineaEritreaEstoniaEthiopiaEuro areaEurope & Central AsiaEurope & Central Asia (excluding high income)Europe & Central Asia (IDA & IBRD countries)European UnionFijiFinlandFragile and conflict affected situationsFranceFrench PolynesiaGabonGambia, TheGeorgiaGermanyGhanaGreeceGreenlandGrenadaGuatemalaGuineaGuinea-BissauGuyanaHaitiHeavily indebted poor countries (HIPC)High incomeHondurasHong Kong SAR, ChinaHungaryIBRD onlyIcelandIDA & IBRD totalIDA blendIDA onlyIDA totalIndiaIndonesiaIran, Islamic Rep.IraqIrelandIsle of ManIsraelItalyJamaicaJapanJordanKazakhstanKenyaKiribatiKorea, Rep.KosovoKuwaitKyrgyz RepublicLao PDRLate-demographic dividendLatin America & Caribbean Latin America & Caribbean (excluding high income)Latin America & the Caribbean (IDA & IBRD countries)LatviaLeast developed countries: UN classificationLebanonLesothoLiberiaLibyaLiechtensteinLithuaniaLow & middle incomeLow incomeLower middle incomeLuxembourgMacao SAR, ChinaMacedonia, FYRMadagascarMalawiMalaysiaMaldivesMaliMaltaMarshall IslandsMauritaniaMauritiusMexicoMicronesia, Fed. Sts.Middle East & North AfricaMiddle East & North Africa (excluding high income)Middle East & North Africa (IDA & IBRD countries)Middle incomeMoldovaMonacoMongoliaMontenegroMoroccoMozambiqueMyanmarNamibiaNauruNepalNetherlandsNew CaledoniaNew ZealandNicaraguaNigerNigeriaNorth AmericaNorwayOECD membersOmanOther small statesPacific island small statesPakistanPalauPanamaPapua New GuineaParaguayPeruPhilippinesPolandPortugalPost-demographic dividendPre-demographic dividendPuerto RicoQatarRomaniaRussian FederationRwandaSamoaSan MarinoSao Tome and PrincipeSaudi ArabiaSenegalSerbiaSeychellesSierra LeoneSingaporeSlovak RepublicSloveniaSmall statesSolomon IslandsSomaliaSouth AfricaSouth AsiaSouth Asia (IDA & IBRD)South SudanSpainSri LankaSt. Kitts and NevisSt. LuciaSt. Vincent and the GrenadinesSub-Saharan Africa Sub-Saharan Africa (excluding high income)Sub-Saharan Africa (IDA & IBRD countries)SudanSurinameSwazilandSwedenSwitzerlandSyrian Arab RepublicTajikistanTanzaniaThailandTimor-LesteTogoTongaTrinidad and TobagoTunisiaTurkeyTurkmenistanTuvaluUgandaUkraineUnited Arab EmiratesUnited KingdomUnited StatesUpper middle incomeUruguayUzbekistanVanuatuVenezuela, RBVietnamVirgin Islands (U.S.)West Bank and GazaWorldYemen, Rep.ZambiaZimbabwe Timeline:
This timeline shows a graph from 1962 to 2016 of China. No data until 1961. Number of actual observations by date: 55.
Source name:
World Development Indicators
Source organization:
World Bank national accounts data, and OECD National Accounts data files.
Categories, topics:
Economy & Growth
Last updated:
apr 23, 2017
Indicators value changes by year
Minimum:
-27.27
jan 1, 1962
At the date of observation
Value
Absolute change
Change from previous value
jan 1, 1962
-27.27
-27.27
0.0%
jan 1, 1963
-5.58
+21.69
-79.54%
jan 1, 1964
10.3
+15.88
-284.59%
jan 1, 1965
18.18
+7.88
76.5%
jan 1, 1966
16.95
-1.23
-6.77%
jan 1, 1967
10.65
-6.3
-37.17%
jan 1, 1968
-5.77
-16.42
-154.18%
jan 1, 1969
-4.1
+1.67
-28.94%
jan 1, 1970
16.94
+21.04
-513.17%
jan 1, 1971
19.3
+2.36
13.93%
jan 1, 1972
7.06
-12.24
-63.42%
jan 1, 1973
3.81
-3.25
-46.03%
jan 1, 1974
7.76
+3.95
103.67%
jan 1, 1975
2.31
-5.45
-70.23%
jan 1, 1976
8.72
+6.41
277.49%
jan 1, 1977
-1.57
-10.29
-118.0%
jan 1, 1978
7.57
+9.14
-582.17%
jan 1, 1979
11.667
+4.097
54.12%
jan 1, 1980
7.6
-4.067
-34.86%
jan 1, 1981
7.807
+0.207
2.72%
jan 1, 1982
5.172
-2.634
-33.74%
jan 1, 1983
8.934
+3.762
72.73%
jan 1, 1984
10.835
+1.901
21.27%
jan 1, 1985
15.139
+4.304
39.72%
jan 1, 1986
13.443
-1.696
-11.2%
jan 1, 1987
8.94
-4.504
-33.5%
jan 1, 1988
11.689
+2.749
30.75%
jan 1, 1989
11.235
-0.454
-3.89%
jan 1, 1990
4.186
-7.049
-62.74%
jan 1, 1991
3.907
-0.279
-6.66%
jan 1, 1992
9.294
+5.387
137.88%
jan 1, 1993
14.216
+4.922
52.96%
jan 1, 1994
13.868
-0.349
-2.45%
jan 1, 1995
13.052
-0.815
-5.88%
jan 1, 1996
10.949
-2.103
-16.11%
jan 1, 1997
9.928
-1.021
-9.32%
jan 1, 1998
9.231
-0.698
-7.03%
jan 1, 1999
7.838
-1.393
-15.09%
jan 1, 2000
7.667
-0.17
-2.17%
jan 1, 2001
8.492
+0.824
10.75%
jan 1, 2002
8.34
-0.152
-1.79%
jan 1, 2003
9.131
+0.791
9.48%
jan 1, 2004
10.036
+0.905
9.91%
jan 1, 2005
10.111
+0.076
0.75%
jan 1, 2006
11.396
+1.285
12.7%
jan 1, 2007
12.719
+1.324
11.62%
jan 1, 2008
14.231
+1.512
11.89%
jan 1, 2009
9.654
-4.577
-32.16%
jan 1, 2010
9.4
-0.254
-2.64%
jan 1, 2011
10.636
+1.236
13.15%
jan 1, 2012
9.536
-1.1
-10.34%
jan 1, 2013
7.856
-1.68
-17.62%
jan 1, 2014
7.758
-0.099
-1.26%
jan 1, 2015
7.298
-0.46
-5.93%
jan 1, 2016
6.914
-0.383
-5.25%
Ranking of countries by current statistics by years


Comments: