29
/
en
AIzaSyAYiBZKx7MnpbEhh9jyipgxe19OcubqV5w
April 1, 2024
146838
Guinea-Bissau
GNB
true
2
1
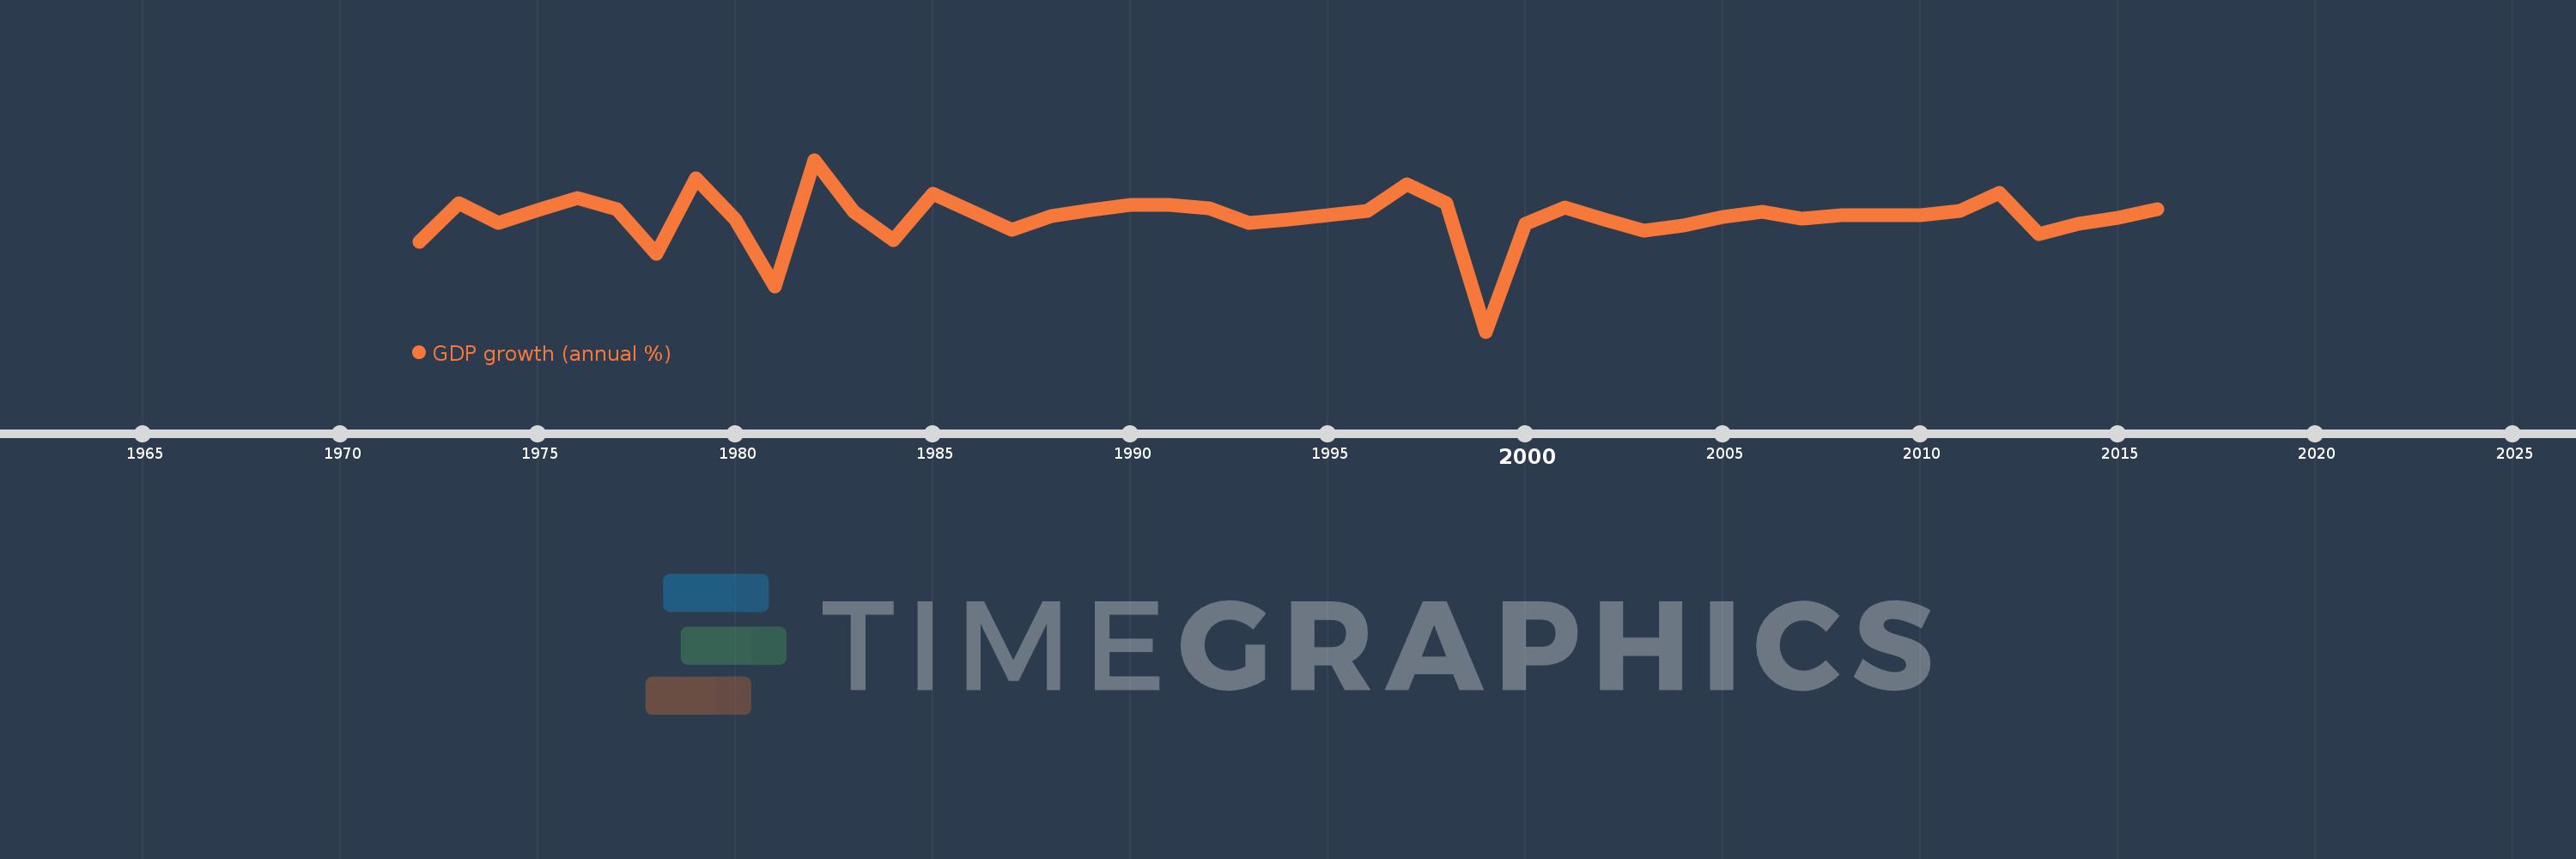
GDP growth (annual %)
2016,2015,2014,2013,2012,2011,2010,2009,2008,2007,2006,2005,2004,2003,2002,2001,2000,1999,1998,1997,1996,1995,1994,1993,1992,1991,1990,1989,1988,1987,1986,1985,1984,1983,1982,1981,1980,1979,1978,1977,1976,1975,1974,1973,1972
This statistics in other country:
AfghanistanAlbaniaAlgeriaAndorraAngolaAntigua and BarbudaArab WorldArgentinaArmeniaArubaAustraliaAustriaAzerbaijanBahamas, TheBahrainBangladeshBarbadosBelarusBelgiumBelizeBeninBermudaBhutanBoliviaBosnia and HerzegovinaBotswanaBrazilBrunei DarussalamBulgariaBurkina FasoBurundiCabo VerdeCambodiaCameroonCanadaCaribbean small statesCayman IslandsCentral African RepublicCentral Europe and the BalticsChadChannel IslandsChileChinaColombiaComorosCongo, Dem. Rep.Congo, Rep.Costa RicaCote d'IvoireCroatiaCubaCyprusCzech RepublicDenmarkDjiboutiDominicaDominican RepublicEarly-demographic dividendEast Asia & PacificEast Asia & Pacific (excluding high income)East Asia & Pacific (IDA & IBRD countries)EcuadorEgypt, Arab Rep.El SalvadorEquatorial GuineaEritreaEstoniaEthiopiaEuro areaEurope & Central AsiaEurope & Central Asia (excluding high income)Europe & Central Asia (IDA & IBRD countries)European UnionFijiFinlandFragile and conflict affected situationsFranceFrench PolynesiaGabonGambia, TheGeorgiaGermanyGhanaGreeceGreenlandGrenadaGuatemalaGuineaGuinea-BissauGuyanaHaitiHeavily indebted poor countries (HIPC)High incomeHondurasHong Kong SAR, ChinaHungaryIBRD onlyIcelandIDA & IBRD totalIDA blendIDA onlyIDA totalIndiaIndonesiaIran, Islamic Rep.IraqIrelandIsle of ManIsraelItalyJamaicaJapanJordanKazakhstanKenyaKiribatiKorea, Rep.KosovoKuwaitKyrgyz RepublicLao PDRLate-demographic dividendLatin America & Caribbean Latin America & Caribbean (excluding high income)Latin America & the Caribbean (IDA & IBRD countries)LatviaLeast developed countries: UN classificationLebanonLesothoLiberiaLibyaLiechtensteinLithuaniaLow & middle incomeLow incomeLower middle incomeLuxembourgMacao SAR, ChinaMacedonia, FYRMadagascarMalawiMalaysiaMaldivesMaliMaltaMarshall IslandsMauritaniaMauritiusMexicoMicronesia, Fed. Sts.Middle East & North AfricaMiddle East & North Africa (excluding high income)Middle East & North Africa (IDA & IBRD countries)Middle incomeMoldovaMonacoMongoliaMontenegroMoroccoMozambiqueMyanmarNamibiaNauruNepalNetherlandsNew CaledoniaNew ZealandNicaraguaNigerNigeriaNorth AmericaNorwayOECD membersOmanOther small statesPacific island small statesPakistanPalauPanamaPapua New GuineaParaguayPeruPhilippinesPolandPortugalPost-demographic dividendPre-demographic dividendPuerto RicoQatarRomaniaRussian FederationRwandaSamoaSan MarinoSao Tome and PrincipeSaudi ArabiaSenegalSerbiaSeychellesSierra LeoneSingaporeSlovak RepublicSloveniaSmall statesSolomon IslandsSomaliaSouth AfricaSouth AsiaSouth Asia (IDA & IBRD)South SudanSpainSri LankaSt. Kitts and NevisSt. LuciaSt. Vincent and the GrenadinesSub-Saharan Africa Sub-Saharan Africa (excluding high income)Sub-Saharan Africa (IDA & IBRD countries)SudanSurinameSwazilandSwedenSwitzerlandSyrian Arab RepublicTajikistanTanzaniaThailandTimor-LesteTogoTongaTrinidad and TobagoTunisiaTurkeyTurkmenistanTuvaluUgandaUkraineUnited Arab EmiratesUnited KingdomUnited StatesUpper middle incomeUruguayUzbekistanVanuatuVenezuela, RBVietnamVirgin Islands (U.S.)West Bank and GazaWorldYemen, Rep.ZambiaZimbabwe Timeline:
This timeline shows a graph from 1972 to 2016 of Guinea-Bissau. No data until 1971. Number of actual observations by date: 45.
Source name:
World Development Indicators
Source organization:
World Bank national accounts data, and OECD National Accounts data files.
Categories, topics:
Economy & Growth
Last updated:
apr 23, 2017
Indicators value changes by year
Maximum:
18.168
jan 1, 1982
At the date of observation
Value
Absolute change
Change from previous value
jan 1, 1972
-3.911
-3.911
0.0%
jan 1, 1973
6.375
+10.286
-263.0%
jan 1, 1974
1.11
-5.265
-82.59%
jan 1, 1975
4.559
+3.449
310.78%
jan 1, 1976
7.846
+3.286
72.08%
jan 1, 1977
4.943
-2.902
-36.99%
jan 1, 1978
-7.17
-12.114
-245.04%
jan 1, 1979
13.126
+20.296
-283.07%
jan 1, 1980
1.994
-11.132
-84.81%
jan 1, 1981
-15.953
-17.947
-899.97%
jan 1, 1982
18.168
+34.12
-213.88%
jan 1, 1983
4.2
-13.967
-76.88%
jan 1, 1984
-3.398
-7.598
-180.91%
jan 1, 1985
9.109
+12.508
-368.05%
jan 1, 1986
4.166
-4.943
-54.26%
jan 1, 1987
-0.794
-4.96
-119.05%
jan 1, 1988
2.9
+3.694
-465.31%
jan 1, 1989
4.6
+1.7
58.62%
jan 1, 1990
6.1
+1.5
32.61%
jan 1, 1992
5.1
-1.0
-16.39%
jan 1, 1993
1.1
-4.0
-78.43%
jan 1, 1994
2.1
+1.0
90.91%
jan 1, 1995
3.2
+1.1
52.38%
jan 1, 1996
4.4
+1.2
37.5%
jan 1, 1997
11.6
+7.2
163.64%
jan 1, 1998
6.5
-5.1
-43.97%
jan 1, 1999
-28.1
-34.6
-532.31%
jan 1, 2000
1.026
+29.126
-103.65%
jan 1, 2001
5.427
+4.401
429.18%
jan 1, 2002
2.189
-3.238
-59.67%
jan 1, 2003
-0.985
-3.174
-145.01%
jan 1, 2004
0.569
+1.554
-157.71%
jan 1, 2005
2.761
+2.193
385.73%
jan 1, 2006
4.265
+1.504
54.47%
jan 1, 2007
2.31
-1.956
-45.85%
jan 1, 2008
3.205
+0.895
38.76%
jan 1, 2009
3.207
+0.002
0.07%
jan 1, 2010
3.312
+0.104
3.25%
jan 1, 2011
4.432
+1.12
33.82%
jan 1, 2012
9.334
+4.902
110.62%
jan 1, 2013
-1.798
-11.132
-119.26%
jan 1, 2014
0.82
+2.618
-145.62%
jan 1, 2015
2.541
+1.721
209.78%
jan 1, 2016
4.797
+2.256
88.77%
Ranking of countries by current statistics by years


Comments: