29
/
en
AIzaSyAYiBZKx7MnpbEhh9jyipgxe19OcubqV5w
April 1, 2024
182075
Luxembourg
LUX
true
2
1
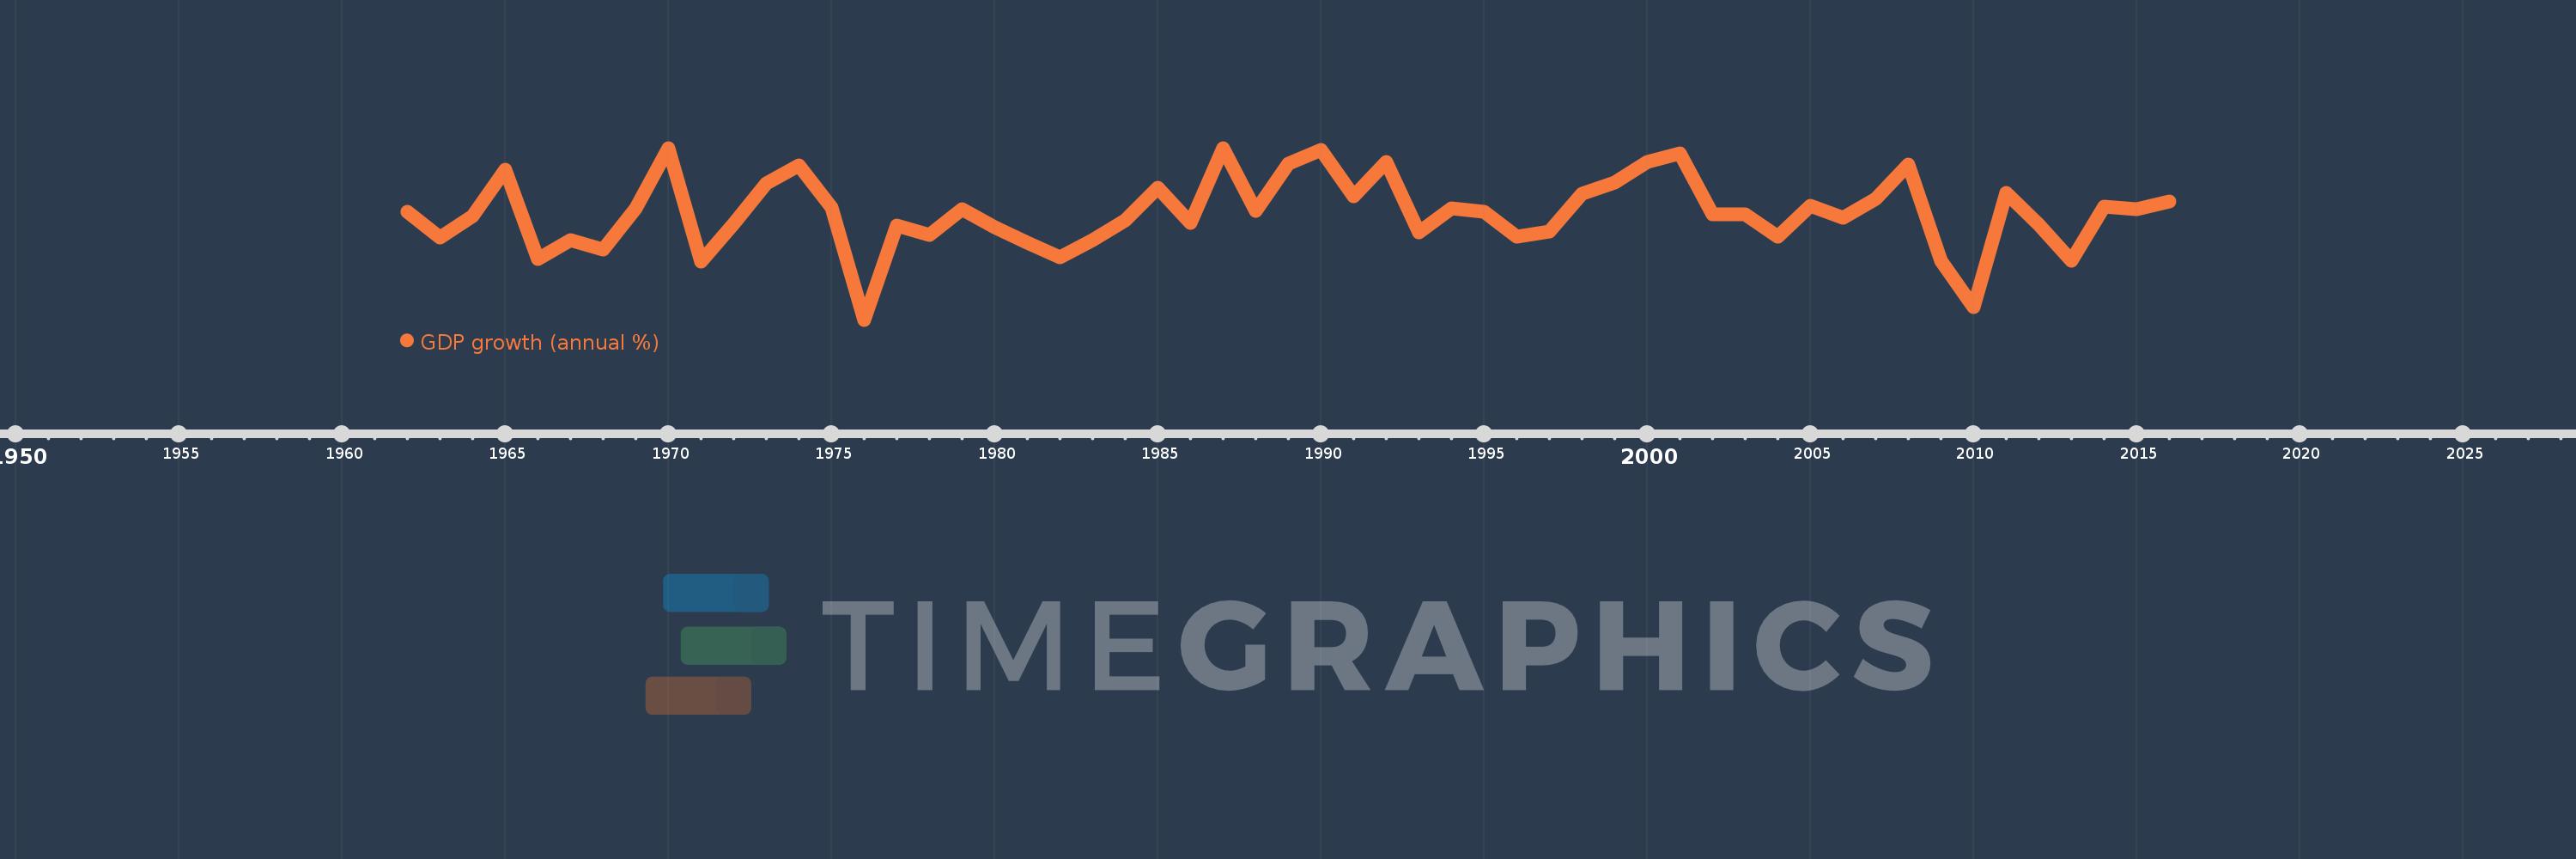
GDP growth (annual %)
2016,2015,2014,2013,2012,2011,2010,2009,2008,2007,2006,2005,2004,2003,2002,2001,2000,1999,1998,1997,1996,1995,1994,1993,1992,1991,1990,1989,1988,1987,1986,1985,1984,1983,1982,1981,1980,1979,1978,1977,1976,1975,1974,1973,1972,1971,1970,1969,1968,1967,1966,1965,1964,1963,1962
This statistics in other country:
AfghanistanAlbaniaAlgeriaAndorraAngolaAntigua and BarbudaArab WorldArgentinaArmeniaArubaAustraliaAustriaAzerbaijanBahamas, TheBahrainBangladeshBarbadosBelarusBelgiumBelizeBeninBermudaBhutanBoliviaBosnia and HerzegovinaBotswanaBrazilBrunei DarussalamBulgariaBurkina FasoBurundiCabo VerdeCambodiaCameroonCanadaCaribbean small statesCayman IslandsCentral African RepublicCentral Europe and the BalticsChadChannel IslandsChileChinaColombiaComorosCongo, Dem. Rep.Congo, Rep.Costa RicaCote d'IvoireCroatiaCubaCyprusCzech RepublicDenmarkDjiboutiDominicaDominican RepublicEarly-demographic dividendEast Asia & PacificEast Asia & Pacific (excluding high income)East Asia & Pacific (IDA & IBRD countries)EcuadorEgypt, Arab Rep.El SalvadorEquatorial GuineaEritreaEstoniaEthiopiaEuro areaEurope & Central AsiaEurope & Central Asia (excluding high income)Europe & Central Asia (IDA & IBRD countries)European UnionFijiFinlandFragile and conflict affected situationsFranceFrench PolynesiaGabonGambia, TheGeorgiaGermanyGhanaGreeceGreenlandGrenadaGuatemalaGuineaGuinea-BissauGuyanaHaitiHeavily indebted poor countries (HIPC)High incomeHondurasHong Kong SAR, ChinaHungaryIBRD onlyIcelandIDA & IBRD totalIDA blendIDA onlyIDA totalIndiaIndonesiaIran, Islamic Rep.IraqIrelandIsle of ManIsraelItalyJamaicaJapanJordanKazakhstanKenyaKiribatiKorea, Rep.KosovoKuwaitKyrgyz RepublicLao PDRLate-demographic dividendLatin America & Caribbean Latin America & Caribbean (excluding high income)Latin America & the Caribbean (IDA & IBRD countries)LatviaLeast developed countries: UN classificationLebanonLesothoLiberiaLibyaLiechtensteinLithuaniaLow & middle incomeLow incomeLower middle incomeLuxembourgMacao SAR, ChinaMacedonia, FYRMadagascarMalawiMalaysiaMaldivesMaliMaltaMarshall IslandsMauritaniaMauritiusMexicoMicronesia, Fed. Sts.Middle East & North AfricaMiddle East & North Africa (excluding high income)Middle East & North Africa (IDA & IBRD countries)Middle incomeMoldovaMonacoMongoliaMontenegroMoroccoMozambiqueMyanmarNamibiaNauruNepalNetherlandsNew CaledoniaNew ZealandNicaraguaNigerNigeriaNorth AmericaNorwayOECD membersOmanOther small statesPacific island small statesPakistanPalauPanamaPapua New GuineaParaguayPeruPhilippinesPolandPortugalPost-demographic dividendPre-demographic dividendPuerto RicoQatarRomaniaRussian FederationRwandaSamoaSan MarinoSao Tome and PrincipeSaudi ArabiaSenegalSerbiaSeychellesSierra LeoneSingaporeSlovak RepublicSloveniaSmall statesSolomon IslandsSomaliaSouth AfricaSouth AsiaSouth Asia (IDA & IBRD)South SudanSpainSri LankaSt. Kitts and NevisSt. LuciaSt. Vincent and the GrenadinesSub-Saharan Africa Sub-Saharan Africa (excluding high income)Sub-Saharan Africa (IDA & IBRD countries)SudanSurinameSwazilandSwedenSwitzerlandSyrian Arab RepublicTajikistanTanzaniaThailandTimor-LesteTogoTongaTrinidad and TobagoTunisiaTurkeyTurkmenistanTuvaluUgandaUkraineUnited Arab EmiratesUnited KingdomUnited StatesUpper middle incomeUruguayUzbekistanVanuatuVenezuela, RBVietnamVirgin Islands (U.S.)West Bank and GazaWorldYemen, Rep.ZambiaZimbabwe Timeline:
This timeline shows a graph from 1962 to 2016 of Luxembourg. No data until 1961. Number of actual observations by date: 55.
Source name:
World Development Indicators
Source organization:
World Bank national accounts data, and OECD National Accounts data files.
Categories, topics:
Economy & Growth
Last updated:
apr 23, 2017
Indicators value changes by year
Minimum:
-6.571
jan 1, 1976
At the date of observation
Value
Absolute change
Change from previous value
jan 1, 1962
3.83
+3.83
0.0%
jan 1, 1963
1.359
-2.471
-64.53%
jan 1, 1964
3.439
+2.08
153.12%
jan 1, 1965
7.866
+4.427
128.72%
jan 1, 1966
-0.735
-8.601
-109.34%
jan 1, 1967
1.106
+1.841
-250.48%
jan 1, 1968
0.217
-0.889
-80.4%
jan 1, 1969
4.184
+3.967
1.83K%
jan 1, 1970
9.973
+5.789
138.36%
jan 1, 1971
-0.999
-10.972
-110.02%
jan 1, 1972
2.667
+3.666
-366.93%
jan 1, 1973
6.598
+3.931
147.38%
jan 1, 1974
8.313
+1.714
25.98%
jan 1, 1975
4.212
-4.1
-49.32%
jan 1, 1976
-6.571
-10.784
-256.0%
jan 1, 1977
2.534
+9.106
-138.57%
jan 1, 1978
1.57
-0.965
-38.06%
jan 1, 1979
4.075
+2.505
159.59%
jan 1, 1980
2.346
-1.729
-42.44%
jan 1, 1981
0.841
-1.505
-64.15%
jan 1, 1982
-0.551
-1.392
-165.52%
jan 1, 1983
1.131
+1.682
-305.34%
jan 1, 1984
2.989
+1.858
164.22%
jan 1, 1985
6.187
+3.198
106.99%
jan 1, 1986
2.792
-3.395
-54.88%
jan 1, 1987
9.984
+7.192
257.63%
jan 1, 1988
3.951
-6.033
-60.43%
jan 1, 1989
8.463
+4.512
114.21%
jan 1, 1990
9.798
+1.335
15.77%
jan 1, 1991
5.32
-4.478
-45.7%
jan 1, 1992
8.644
+3.324
62.49%
jan 1, 1993
1.82
-6.825
-78.95%
jan 1, 1994
4.201
+2.381
130.85%
jan 1, 1995
3.821
-0.38
-9.04%
jan 1, 1996
1.432
-2.389
-62.52%
jan 1, 1997
1.923
+0.491
34.29%
jan 1, 1998
5.579
+3.656
190.09%
jan 1, 1999
6.632
+1.053
18.88%
jan 1, 2000
8.668
+2.036
30.7%
jan 1, 2001
9.466
+0.798
9.2%
jan 1, 2002
3.579
-5.887
-62.19%
jan 1, 2003
3.621
+0.042
1.16%
jan 1, 2004
1.398
-2.223
-61.4%
jan 1, 2005
4.411
+3.013
215.61%
jan 1, 2006
3.216
-1.195
-27.08%
jan 1, 2007
5.111
+1.894
58.89%
jan 1, 2008
8.396
+3.285
64.28%
jan 1, 2009
-0.843
-9.239
-110.04%
jan 1, 2010
-5.377
-4.534
537.75%
jan 1, 2011
5.677
+11.054
-205.57%
jan 1, 2012
2.566
-3.111
-54.8%
jan 1, 2013
-0.847
-3.413
-133.02%
jan 1, 2014
4.347
+5.194
-613.14%
jan 1, 2015
4.069
-0.277
-6.38%
jan 1, 2016
4.849
+0.78
19.17%
Ranking of countries by current statistics by years


Comments: