29
/
en
AIzaSyAYiBZKx7MnpbEhh9jyipgxe19OcubqV5w
April 1, 2024
57046
South Asia
SAS
false
2
1
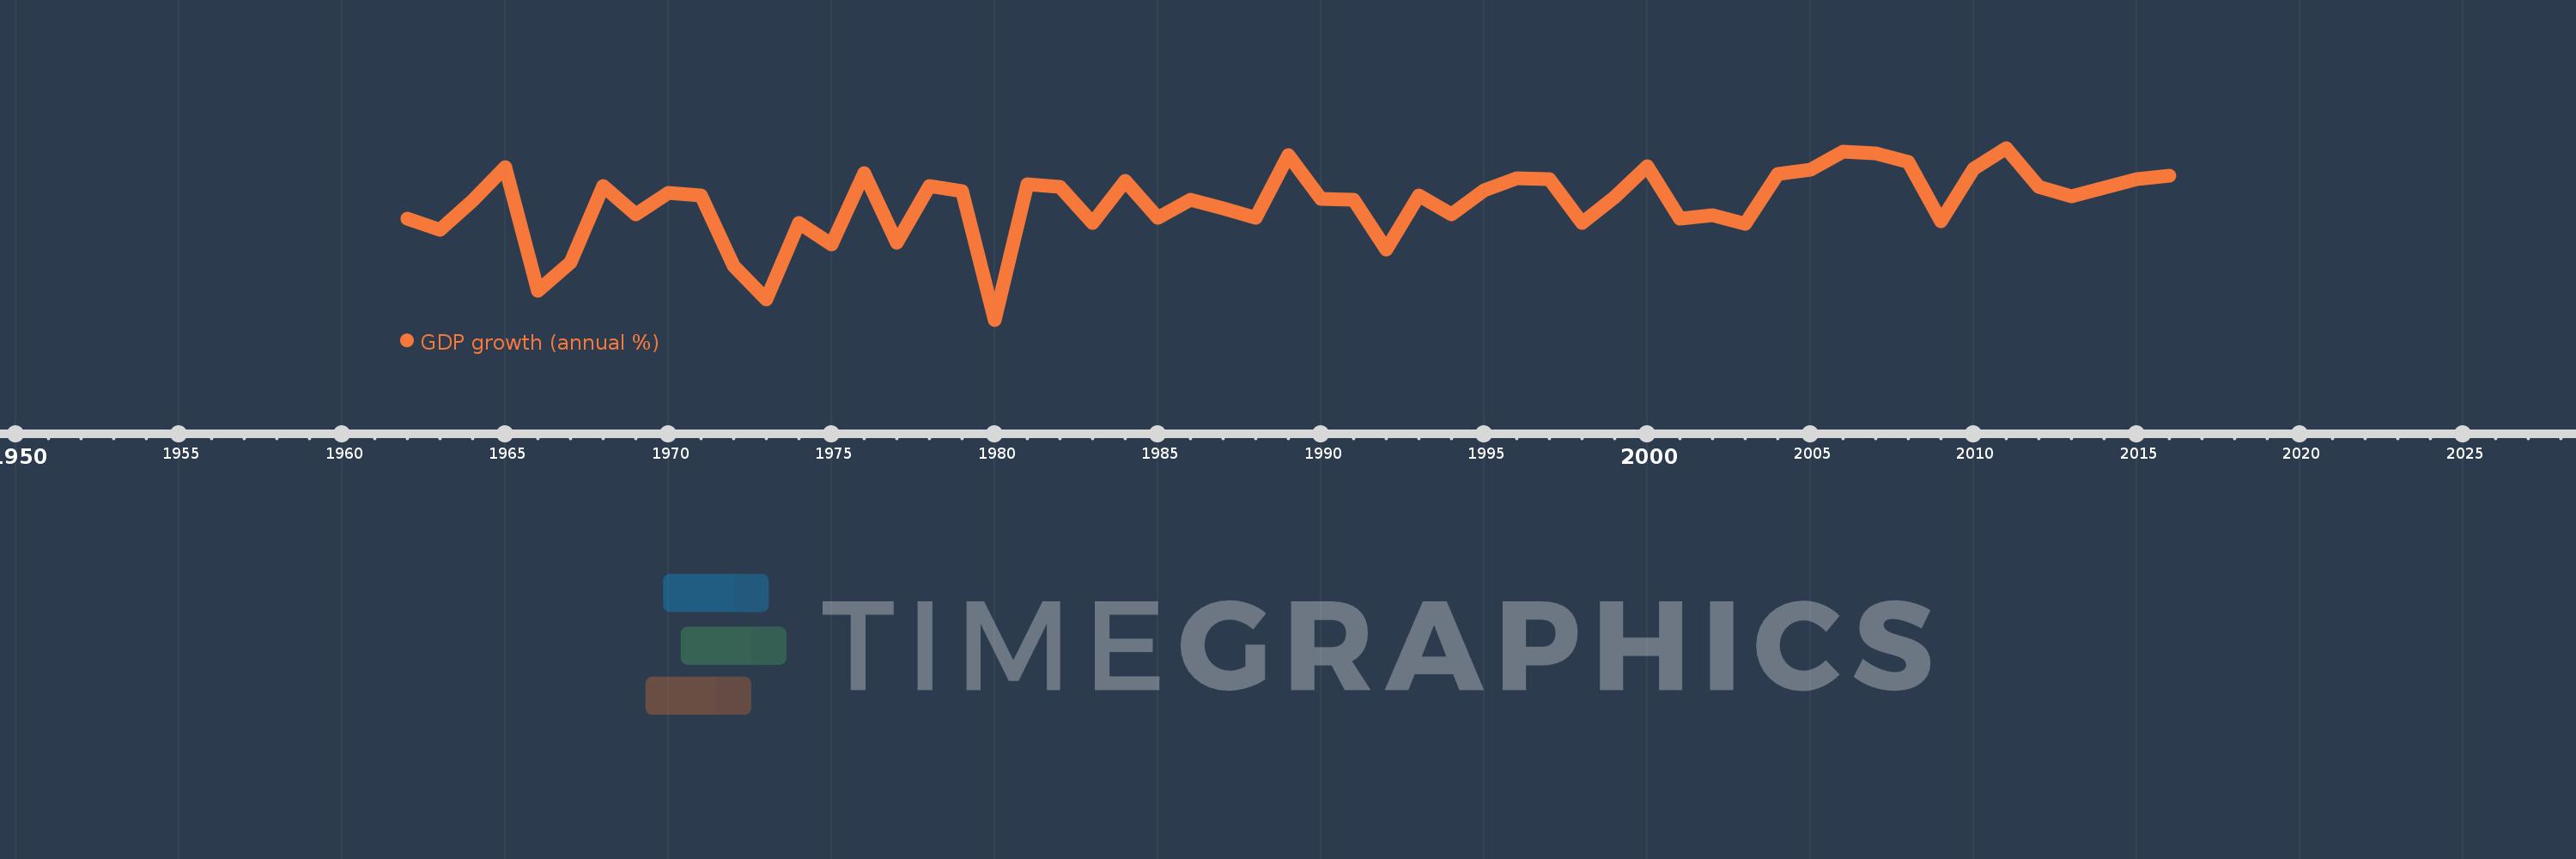
GDP growth (annual %)
2016,2015,2014,2013,2012,2011,2010,2009,2008,2007,2006,2005,2004,2003,2002,2001,2000,1999,1998,1997,1996,1995,1994,1993,1992,1991,1990,1989,1988,1987,1986,1985,1984,1983,1982,1981,1980,1979,1978,1977,1976,1975,1974,1973,1972,1971,1970,1969,1968,1967,1966,1965,1964,1963,1962
This statistics in other country:
AfghanistanAlbaniaAlgeriaAndorraAngolaAntigua and BarbudaArab WorldArgentinaArmeniaArubaAustraliaAustriaAzerbaijanBahamas, TheBahrainBangladeshBarbadosBelarusBelgiumBelizeBeninBermudaBhutanBoliviaBosnia and HerzegovinaBotswanaBrazilBrunei DarussalamBulgariaBurkina FasoBurundiCabo VerdeCambodiaCameroonCanadaCaribbean small statesCayman IslandsCentral African RepublicCentral Europe and the BalticsChadChannel IslandsChileChinaColombiaComorosCongo, Dem. Rep.Congo, Rep.Costa RicaCote d'IvoireCroatiaCubaCyprusCzech RepublicDenmarkDjiboutiDominicaDominican RepublicEarly-demographic dividendEast Asia & PacificEast Asia & Pacific (excluding high income)East Asia & Pacific (IDA & IBRD countries)EcuadorEgypt, Arab Rep.El SalvadorEquatorial GuineaEritreaEstoniaEthiopiaEuro areaEurope & Central AsiaEurope & Central Asia (excluding high income)Europe & Central Asia (IDA & IBRD countries)European UnionFijiFinlandFragile and conflict affected situationsFranceFrench PolynesiaGabonGambia, TheGeorgiaGermanyGhanaGreeceGreenlandGrenadaGuatemalaGuineaGuinea-BissauGuyanaHaitiHeavily indebted poor countries (HIPC)High incomeHondurasHong Kong SAR, ChinaHungaryIBRD onlyIcelandIDA & IBRD totalIDA blendIDA onlyIDA totalIndiaIndonesiaIran, Islamic Rep.IraqIrelandIsle of ManIsraelItalyJamaicaJapanJordanKazakhstanKenyaKiribatiKorea, Rep.KosovoKuwaitKyrgyz RepublicLao PDRLate-demographic dividendLatin America & Caribbean Latin America & Caribbean (excluding high income)Latin America & the Caribbean (IDA & IBRD countries)LatviaLeast developed countries: UN classificationLebanonLesothoLiberiaLibyaLiechtensteinLithuaniaLow & middle incomeLow incomeLower middle incomeLuxembourgMacao SAR, ChinaMacedonia, FYRMadagascarMalawiMalaysiaMaldivesMaliMaltaMarshall IslandsMauritaniaMauritiusMexicoMicronesia, Fed. Sts.Middle East & North AfricaMiddle East & North Africa (excluding high income)Middle East & North Africa (IDA & IBRD countries)Middle incomeMoldovaMonacoMongoliaMontenegroMoroccoMozambiqueMyanmarNamibiaNauruNepalNetherlandsNew CaledoniaNew ZealandNicaraguaNigerNigeriaNorth AmericaNorwayOECD membersOmanOther small statesPacific island small statesPakistanPalauPanamaPapua New GuineaParaguayPeruPhilippinesPolandPortugalPost-demographic dividendPre-demographic dividendPuerto RicoQatarRomaniaRussian FederationRwandaSamoaSan MarinoSao Tome and PrincipeSaudi ArabiaSenegalSerbiaSeychellesSierra LeoneSingaporeSlovak RepublicSloveniaSmall statesSolomon IslandsSomaliaSouth AfricaSouth AsiaSouth Asia (IDA & IBRD)South SudanSpainSri LankaSt. Kitts and NevisSt. LuciaSt. Vincent and the GrenadinesSub-Saharan Africa Sub-Saharan Africa (excluding high income)Sub-Saharan Africa (IDA & IBRD countries)SudanSurinameSwazilandSwedenSwitzerlandSyrian Arab RepublicTajikistanTanzaniaThailandTimor-LesteTogoTongaTrinidad and TobagoTunisiaTurkeyTurkmenistanTuvaluUgandaUkraineUnited Arab EmiratesUnited KingdomUnited StatesUpper middle incomeUruguayUzbekistanVanuatuVenezuela, RBVietnamVirgin Islands (U.S.)West Bank and GazaWorldYemen, Rep.ZambiaZimbabwe Timeline:
This timeline shows a graph from 1962 to 2016 of South Asia. No data until 1961. Number of actual observations by date: 55.
Source name:
World Development Indicators
Source organization:
World Bank national accounts data, and OECD National Accounts data files.
Categories, topics:
Economy & Growth
Last updated:
apr 23, 2017
Indicators value changes by year
Minimum:
-3.008
jan 1, 1980
At the date of observation
Value
Absolute change
Change from previous value
jan 1, 1962
4.116
+4.116
0.0%
jan 1, 1963
3.323
-0.793
-19.26%
jan 1, 1964
5.364
+2.041
61.4%
jan 1, 1965
7.698
+2.334
43.51%
jan 1, 1966
-0.966
-8.663
-112.55%
jan 1, 1967
1.006
+1.972
-204.19%
jan 1, 1968
6.385
+5.379
534.42%
jan 1, 1969
4.386
-1.999
-31.31%
jan 1, 1970
5.907
+1.521
34.68%
jan 1, 1971
5.722
-0.185
-3.13%
jan 1, 1972
0.781
-4.941
-86.35%
jan 1, 1973
-1.593
-2.375
-303.98%
jan 1, 1974
3.765
+5.359
-336.32%
jan 1, 1975
2.264
-1.502
-39.88%
jan 1, 1976
7.278
+5.014
221.51%
jan 1, 1977
2.428
-4.85
-66.64%
jan 1, 1978
6.408
+3.98
163.94%
jan 1, 1979
6.045
-0.363
-5.67%
jan 1, 1980
-3.008
-9.053
-149.77%
jan 1, 1981
6.498
+9.506
-315.99%
jan 1, 1982
6.35
-0.148
-2.28%
jan 1, 1983
3.768
-2.582
-40.66%
jan 1, 1984
6.749
+2.981
79.11%
jan 1, 1985
4.16
-2.589
-38.36%
jan 1, 1986
5.401
+1.242
29.85%
jan 1, 1987
4.81
-0.591
-10.95%
jan 1, 1988
4.176
-0.634
-13.17%
jan 1, 1989
8.55
+4.374
104.73%
jan 1, 1990
5.461
-3.089
-36.13%
jan 1, 1991
5.422
-0.039
-0.71%
jan 1, 1992
1.911
-3.512
-64.76%
jan 1, 1993
5.721
+3.81
199.42%
jan 1, 1994
4.405
-1.317
-23.01%
jan 1, 1995
6.062
+1.658
37.64%
jan 1, 1996
6.954
+0.892
14.71%
jan 1, 1997
6.854
-0.1
-1.44%
jan 1, 1998
3.791
-3.063
-44.69%
jan 1, 1999
5.596
+1.804
47.59%
jan 1, 2000
7.766
+2.171
38.79%
jan 1, 2001
4.076
-3.69
-47.51%
jan 1, 2002
4.312
+0.236
5.78%
jan 1, 2003
3.715
-0.597
-13.85%
jan 1, 2004
7.244
+3.53
95.01%
jan 1, 2005
7.544
+0.3
4.14%
jan 1, 2006
8.787
+1.243
16.47%
jan 1, 2007
8.668
-0.119
-1.35%
jan 1, 2008
8.074
-0.594
-6.85%
jan 1, 2009
3.883
-4.191
-51.9%
jan 1, 2010
7.614
+3.731
96.07%
jan 1, 2011
9.055
+1.441
18.93%
jan 1, 2012
6.314
-2.742
-30.28%
jan 1, 2013
5.65
-0.663
-10.5%
jan 1, 2014
6.26
+0.609
10.78%
jan 1, 2015
6.841
+0.582
9.29%
jan 1, 2016
7.11
+0.268
3.92%
Ranking of countries by current statistics by years


Comments: