29
/
en
AIzaSyAYiBZKx7MnpbEhh9jyipgxe19OcubqV5w
April 1, 2024
55522
Pre-demographic dividend
PRE
false
2
1
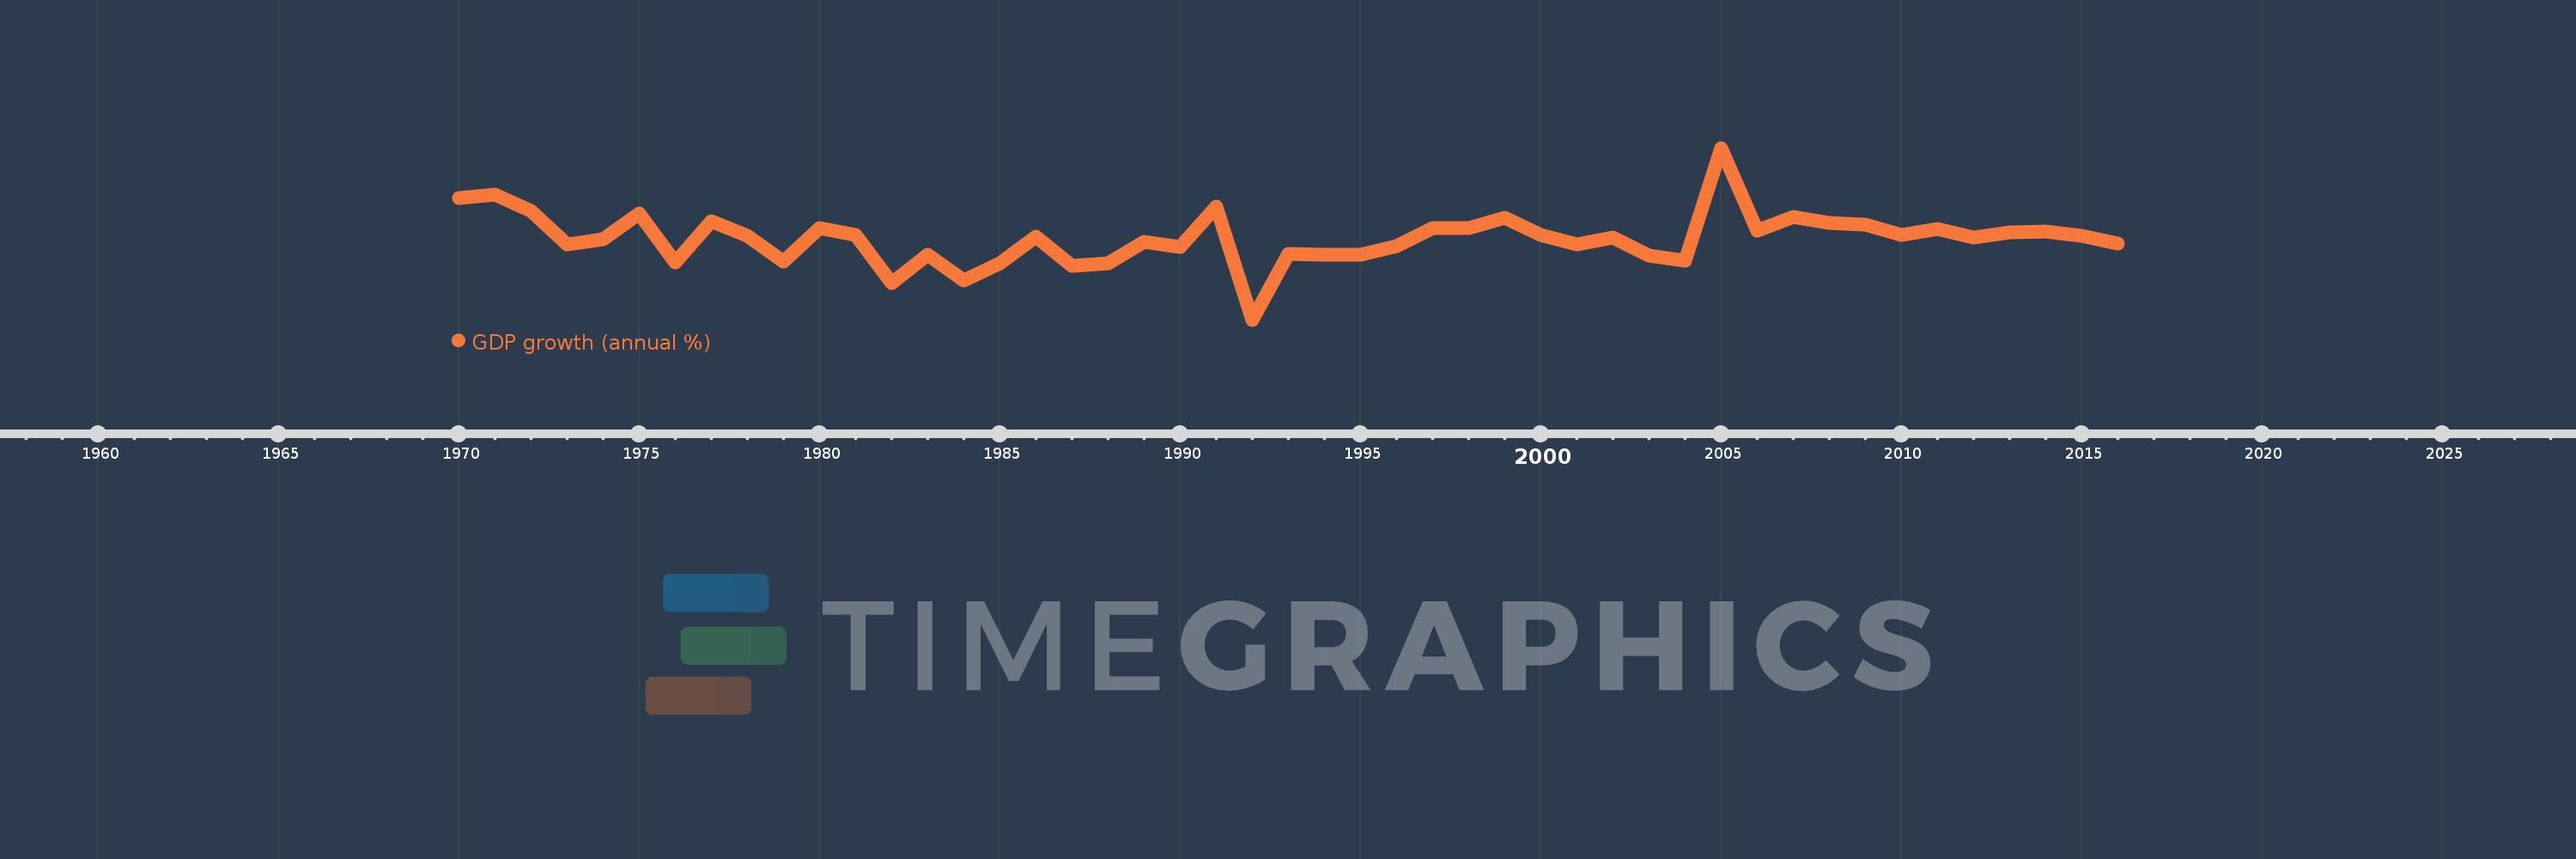
GDP growth (annual %)
2016,2015,2014,2013,2012,2011,2010,2009,2008,2007,2006,2005,2004,2003,2002,2001,2000,1999,1998,1997,1996,1995,1994,1993,1992,1991,1990,1989,1988,1987,1986,1985,1984,1983,1982,1981,1980,1979,1978,1977,1976,1975,1974,1973,1972,1971,1970
This statistics in other country:
AfghanistanAlbaniaAlgeriaAndorraAngolaAntigua and BarbudaArab WorldArgentinaArmeniaArubaAustraliaAustriaAzerbaijanBahamas, TheBahrainBangladeshBarbadosBelarusBelgiumBelizeBeninBermudaBhutanBoliviaBosnia and HerzegovinaBotswanaBrazilBrunei DarussalamBulgariaBurkina FasoBurundiCabo VerdeCambodiaCameroonCanadaCaribbean small statesCayman IslandsCentral African RepublicCentral Europe and the BalticsChadChannel IslandsChileChinaColombiaComorosCongo, Dem. Rep.Congo, Rep.Costa RicaCote d'IvoireCroatiaCubaCyprusCzech RepublicDenmarkDjiboutiDominicaDominican RepublicEarly-demographic dividendEast Asia & PacificEast Asia & Pacific (excluding high income)East Asia & Pacific (IDA & IBRD countries)EcuadorEgypt, Arab Rep.El SalvadorEquatorial GuineaEritreaEstoniaEthiopiaEuro areaEurope & Central AsiaEurope & Central Asia (excluding high income)Europe & Central Asia (IDA & IBRD countries)European UnionFijiFinlandFragile and conflict affected situationsFranceFrench PolynesiaGabonGambia, TheGeorgiaGermanyGhanaGreeceGreenlandGrenadaGuatemalaGuineaGuinea-BissauGuyanaHaitiHeavily indebted poor countries (HIPC)High incomeHondurasHong Kong SAR, ChinaHungaryIBRD onlyIcelandIDA & IBRD totalIDA blendIDA onlyIDA totalIndiaIndonesiaIran, Islamic Rep.IraqIrelandIsle of ManIsraelItalyJamaicaJapanJordanKazakhstanKenyaKiribatiKorea, Rep.KosovoKuwaitKyrgyz RepublicLao PDRLate-demographic dividendLatin America & Caribbean Latin America & Caribbean (excluding high income)Latin America & the Caribbean (IDA & IBRD countries)LatviaLeast developed countries: UN classificationLebanonLesothoLiberiaLibyaLiechtensteinLithuaniaLow & middle incomeLow incomeLower middle incomeLuxembourgMacao SAR, ChinaMacedonia, FYRMadagascarMalawiMalaysiaMaldivesMaliMaltaMarshall IslandsMauritaniaMauritiusMexicoMicronesia, Fed. Sts.Middle East & North AfricaMiddle East & North Africa (excluding high income)Middle East & North Africa (IDA & IBRD countries)Middle incomeMoldovaMonacoMongoliaMontenegroMoroccoMozambiqueMyanmarNamibiaNauruNepalNetherlandsNew CaledoniaNew ZealandNicaraguaNigerNigeriaNorth AmericaNorwayOECD membersOmanOther small statesPacific island small statesPakistanPalauPanamaPapua New GuineaParaguayPeruPhilippinesPolandPortugalPost-demographic dividendPre-demographic dividendPuerto RicoQatarRomaniaRussian FederationRwandaSamoaSan MarinoSao Tome and PrincipeSaudi ArabiaSenegalSerbiaSeychellesSierra LeoneSingaporeSlovak RepublicSloveniaSmall statesSolomon IslandsSomaliaSouth AfricaSouth AsiaSouth Asia (IDA & IBRD)South SudanSpainSri LankaSt. Kitts and NevisSt. LuciaSt. Vincent and the GrenadinesSub-Saharan Africa Sub-Saharan Africa (excluding high income)Sub-Saharan Africa (IDA & IBRD countries)SudanSurinameSwazilandSwedenSwitzerlandSyrian Arab RepublicTajikistanTanzaniaThailandTimor-LesteTogoTongaTrinidad and TobagoTunisiaTurkeyTurkmenistanTuvaluUgandaUkraineUnited Arab EmiratesUnited KingdomUnited StatesUpper middle incomeUruguayUzbekistanVanuatuVenezuela, RBVietnamVirgin Islands (U.S.)West Bank and GazaWorldYemen, Rep.ZambiaZimbabwe Timeline:
This timeline shows a graph from 1970 to 2016 of Pre-demographic dividend. No data until 1969. Number of actual observations by date: 47.
Source name:
World Development Indicators
Source organization:
World Bank national accounts data, and OECD National Accounts data files.
Categories, topics:
Economy & Growth
Last updated:
apr 23, 2017
Indicators value changes by year
Maximum:
21.298
jan 1, 2005
At the date of observation
Value
Absolute change
Change from previous value
jan 1, 1970
11.889
+11.889
0.0%
jan 1, 1971
12.579
+0.689
5.8%
jan 1, 1972
9.483
-3.096
-24.61%
jan 1, 1973
3.224
-6.259
-66.0%
jan 1, 1974
4.081
+0.857
26.59%
jan 1, 1975
8.99
+4.909
120.29%
jan 1, 1976
-0.263
-9.254
-102.93%
jan 1, 1977
7.508
+7.772
-2.95K%
jan 1, 1978
4.728
-2.78
-37.02%
jan 1, 1979
-0.094
-4.822
-101.99%
jan 1, 1980
6.242
+6.336
-6.74K%
jan 1, 1981
4.903
-1.339
-21.45%
jan 1, 1982
-4.104
-9.007
-183.7%
jan 1, 1983
1.206
+5.309
-129.38%
jan 1, 1984
-3.618
-4.823
-400.09%
jan 1, 1985
-0.381
+3.237
-89.48%
jan 1, 1986
4.691
+5.072
-1.33K%
jan 1, 1987
-0.855
-5.546
-118.22%
jan 1, 1988
-0.327
+0.528
-61.74%
jan 1, 1989
3.57
+3.897
-1.19K%
jan 1, 1990
2.69
-0.881
-24.66%
jan 1, 1991
10.313
+7.623
283.41%
jan 1, 1992
-11.0
-21.314
-206.66%
jan 1, 1993
1.315
+12.315
-111.95%
jan 1, 1994
1.304
-0.01
-0.78%
jan 1, 1995
1.265
-0.039
-2.97%
jan 1, 1996
2.908
+1.642
129.77%
jan 1, 1997
6.217
+3.309
113.81%
jan 1, 1998
6.219
+0.002
0.03%
jan 1, 1999
8.184
+1.964
31.58%
jan 1, 2000
4.921
-3.262
-39.86%
jan 1, 2001
3.128
-1.794
-36.45%
jan 1, 2002
4.392
+1.264
40.41%
jan 1, 2003
0.988
-3.404
-77.51%
jan 1, 2004
0.148
-0.84
-85.01%
jan 1, 2005
21.298
+21.15
14.28K%
jan 1, 2006
5.735
-15.563
-73.07%
jan 1, 2007
8.383
+2.648
46.18%
jan 1, 2008
7.216
-1.168
-13.93%
jan 1, 2009
6.874
-0.342
-4.74%
jan 1, 2010
4.941
-1.933
-28.12%
jan 1, 2011
6.108
+1.167
23.61%
jan 1, 2012
4.516
-1.591
-26.05%
jan 1, 2013
5.409
+0.892
19.76%
jan 1, 2014
5.521
+0.112
2.08%
jan 1, 2015
4.708
-0.813
-14.72%
jan 1, 2016
3.31
-1.398
-29.69%
Ranking of countries by current statistics by years


Comments: