29
/
en
AIzaSyAYiBZKx7MnpbEhh9jyipgxe19OcubqV5w
April 1, 2024
240450
Singapore
SGP
true
2
1
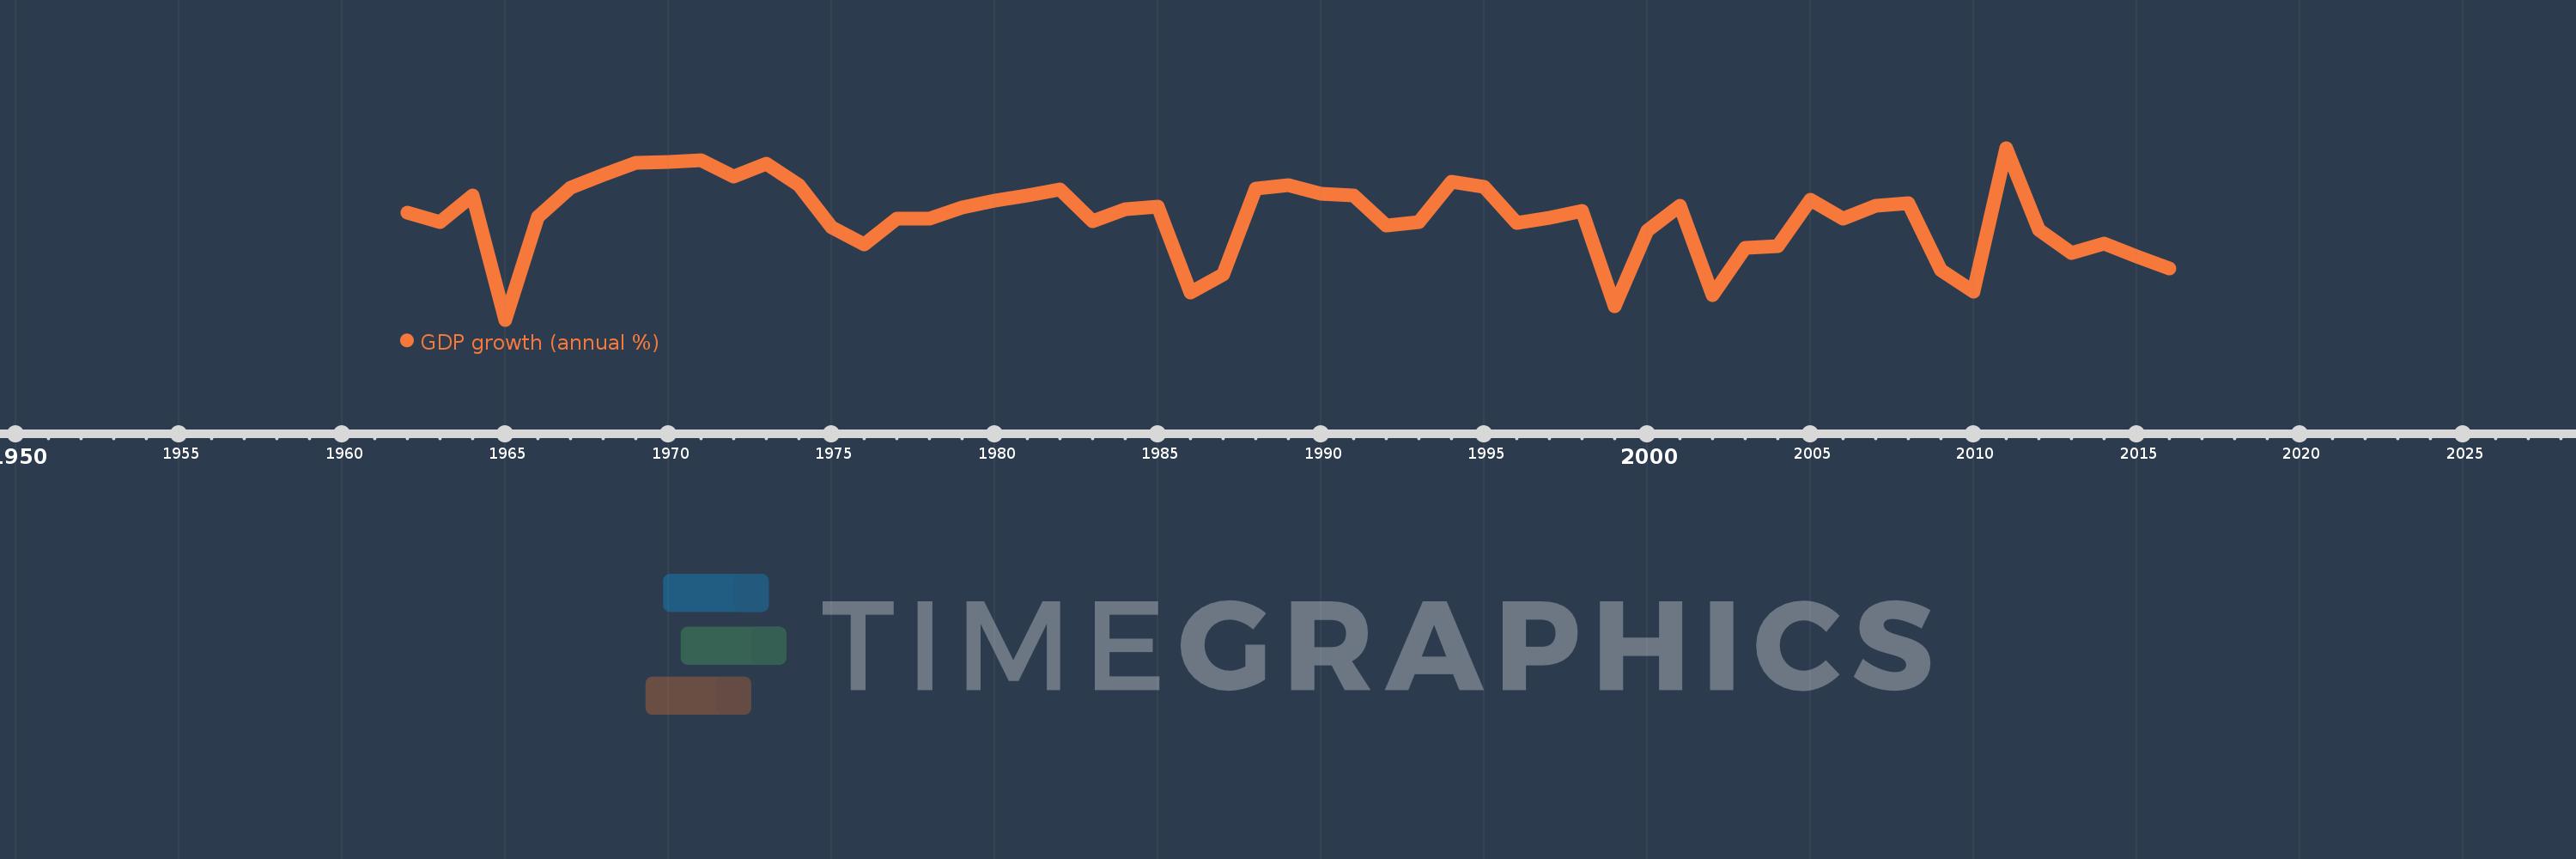
GDP growth (annual %)
2016,2015,2014,2013,2012,2011,2010,2009,2008,2007,2006,2005,2004,2003,2002,2001,2000,1999,1998,1997,1996,1995,1994,1993,1992,1991,1990,1989,1988,1987,1986,1985,1984,1983,1982,1981,1980,1979,1978,1977,1976,1975,1974,1973,1972,1971,1970,1969,1968,1967,1966,1965,1964,1963,1962
This statistics in other country:
AfghanistanAlbaniaAlgeriaAndorraAngolaAntigua and BarbudaArab WorldArgentinaArmeniaArubaAustraliaAustriaAzerbaijanBahamas, TheBahrainBangladeshBarbadosBelarusBelgiumBelizeBeninBermudaBhutanBoliviaBosnia and HerzegovinaBotswanaBrazilBrunei DarussalamBulgariaBurkina FasoBurundiCabo VerdeCambodiaCameroonCanadaCaribbean small statesCayman IslandsCentral African RepublicCentral Europe and the BalticsChadChannel IslandsChileChinaColombiaComorosCongo, Dem. Rep.Congo, Rep.Costa RicaCote d'IvoireCroatiaCubaCyprusCzech RepublicDenmarkDjiboutiDominicaDominican RepublicEarly-demographic dividendEast Asia & PacificEast Asia & Pacific (excluding high income)East Asia & Pacific (IDA & IBRD countries)EcuadorEgypt, Arab Rep.El SalvadorEquatorial GuineaEritreaEstoniaEthiopiaEuro areaEurope & Central AsiaEurope & Central Asia (excluding high income)Europe & Central Asia (IDA & IBRD countries)European UnionFijiFinlandFragile and conflict affected situationsFranceFrench PolynesiaGabonGambia, TheGeorgiaGermanyGhanaGreeceGreenlandGrenadaGuatemalaGuineaGuinea-BissauGuyanaHaitiHeavily indebted poor countries (HIPC)High incomeHondurasHong Kong SAR, ChinaHungaryIBRD onlyIcelandIDA & IBRD totalIDA blendIDA onlyIDA totalIndiaIndonesiaIran, Islamic Rep.IraqIrelandIsle of ManIsraelItalyJamaicaJapanJordanKazakhstanKenyaKiribatiKorea, Rep.KosovoKuwaitKyrgyz RepublicLao PDRLate-demographic dividendLatin America & Caribbean Latin America & Caribbean (excluding high income)Latin America & the Caribbean (IDA & IBRD countries)LatviaLeast developed countries: UN classificationLebanonLesothoLiberiaLibyaLiechtensteinLithuaniaLow & middle incomeLow incomeLower middle incomeLuxembourgMacao SAR, ChinaMacedonia, FYRMadagascarMalawiMalaysiaMaldivesMaliMaltaMarshall IslandsMauritaniaMauritiusMexicoMicronesia, Fed. Sts.Middle East & North AfricaMiddle East & North Africa (excluding high income)Middle East & North Africa (IDA & IBRD countries)Middle incomeMoldovaMonacoMongoliaMontenegroMoroccoMozambiqueMyanmarNamibiaNauruNepalNetherlandsNew CaledoniaNew ZealandNicaraguaNigerNigeriaNorth AmericaNorwayOECD membersOmanOther small statesPacific island small statesPakistanPalauPanamaPapua New GuineaParaguayPeruPhilippinesPolandPortugalPost-demographic dividendPre-demographic dividendPuerto RicoQatarRomaniaRussian FederationRwandaSamoaSan MarinoSao Tome and PrincipeSaudi ArabiaSenegalSerbiaSeychellesSierra LeoneSingaporeSlovak RepublicSloveniaSmall statesSolomon IslandsSomaliaSouth AfricaSouth AsiaSouth Asia (IDA & IBRD)South SudanSpainSri LankaSt. Kitts and NevisSt. LuciaSt. Vincent and the GrenadinesSub-Saharan Africa Sub-Saharan Africa (excluding high income)Sub-Saharan Africa (IDA & IBRD countries)SudanSurinameSwazilandSwedenSwitzerlandSyrian Arab RepublicTajikistanTanzaniaThailandTimor-LesteTogoTongaTrinidad and TobagoTunisiaTurkeyTurkmenistanTuvaluUgandaUkraineUnited Arab EmiratesUnited KingdomUnited StatesUpper middle incomeUruguayUzbekistanVanuatuVenezuela, RBVietnamVirgin Islands (U.S.)West Bank and GazaWorldYemen, Rep.ZambiaZimbabwe Timeline:
This timeline shows a graph from 1962 to 2016 of Singapore. No data until 1961. Number of actual observations by date: 55.
Source name:
World Development Indicators
Source organization:
World Bank national accounts data, and OECD National Accounts data files.
Categories, topics:
Economy & Growth
Last updated:
apr 23, 2017
Indicators value changes by year
At the date of observation
Value
Absolute change
Change from previous value
jan 1, 1962
8.138
+8.138
0.0%
jan 1, 1963
7.122
-1.016
-12.48%
jan 1, 1964
9.985
+2.863
40.2%
jan 1, 1965
-3.68
-13.665
-136.86%
jan 1, 1966
7.597
+11.278
-306.42%
jan 1, 1967
10.872
+3.275
43.1%
jan 1, 1968
12.284
+1.412
12.98%
jan 1, 1969
13.618
+1.335
10.86%
jan 1, 1970
13.725
+0.107
0.78%
jan 1, 1971
13.886
+0.161
1.17%
jan 1, 1972
12.081
-1.804
-12.99%
jan 1, 1973
13.527
+1.445
11.96%
jan 1, 1974
11.128
-2.399
-17.73%
jan 1, 1975
6.468
-4.66
-41.88%
jan 1, 1976
4.609
-1.859
-28.74%
jan 1, 1977
7.437
+2.828
61.35%
jan 1, 1978
7.486
+0.049
0.66%
jan 1, 1979
8.703
+1.217
16.26%
jan 1, 1980
9.42
+0.716
8.23%
jan 1, 1981
10.027
+0.607
6.45%
jan 1, 1982
10.684
+0.657
6.55%
jan 1, 1983
7.172
-3.511
-32.87%
jan 1, 1984
8.54
+1.368
19.07%
jan 1, 1985
8.801
+0.26
3.05%
jan 1, 1986
-0.687
-9.488
-107.81%
jan 1, 1987
1.328
+2.015
-293.24%
jan 1, 1988
10.757
+9.429
710.23%
jan 1, 1989
11.115
+0.358
3.33%
jan 1, 1990
10.183
-0.932
-8.39%
jan 1, 1991
10.044
-0.139
-1.36%
jan 1, 1992
6.687
-3.357
-33.42%
jan 1, 1993
7.088
+0.401
5.99%
jan 1, 1994
11.537
+4.45
62.78%
jan 1, 1995
10.925
-0.612
-5.3%
jan 1, 1996
7.028
-3.897
-35.67%
jan 1, 1997
7.532
+0.504
7.17%
jan 1, 1998
8.291
+0.759
10.08%
jan 1, 1999
-2.225
-10.516
-126.84%
jan 1, 2000
6.095
+8.32
-373.91%
jan 1, 2001
8.898
+2.802
45.98%
jan 1, 2002
-0.952
-9.85
-110.7%
jan 1, 2003
4.212
+5.164
-542.27%
jan 1, 2004
4.435
+0.224
5.31%
jan 1, 2005
9.549
+5.114
115.3%
jan 1, 2006
7.489
-2.06
-21.57%
jan 1, 2007
8.86
+1.371
18.31%
jan 1, 2008
9.112
+0.251
2.84%
jan 1, 2009
1.788
-7.324
-80.38%
jan 1, 2010
-0.603
-2.391
-133.75%
jan 1, 2011
15.24
+15.844
-2.63K%
jan 1, 2012
6.207
-9.033
-59.27%
jan 1, 2013
3.67
-2.537
-40.88%
jan 1, 2014
4.675
+1.005
27.39%
jan 1, 2015
3.26
-1.415
-30.27%
jan 1, 2016
2.008
-1.252
-38.39%
Ranking of countries by current statistics by years


Comments: