29
/
en
AIzaSyAYiBZKx7MnpbEhh9jyipgxe19OcubqV5w
April 1, 2024
59784
Sub-Saharan Africa (excluding high income)
SSA
false
2
1
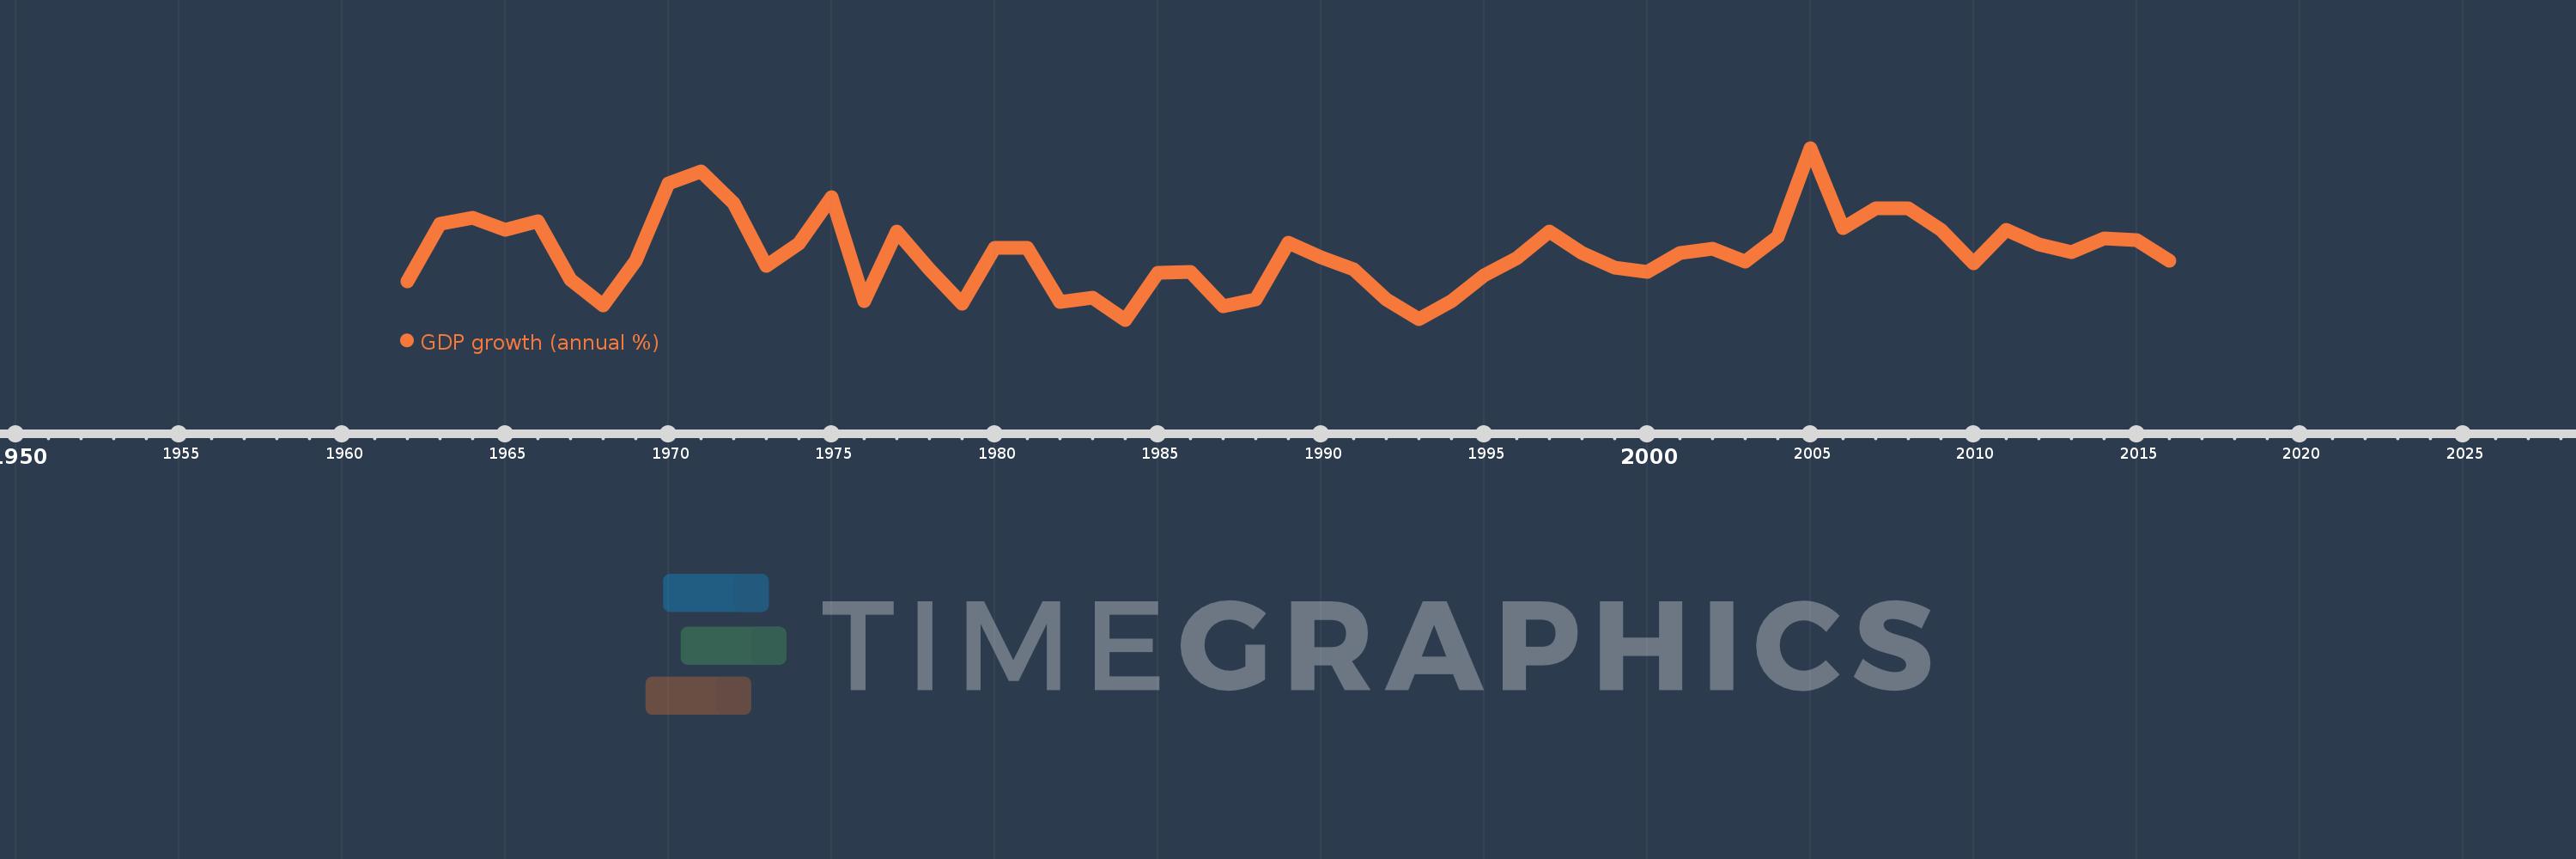
GDP growth (annual %)
2016,2015,2014,2013,2012,2011,2010,2009,2008,2007,2006,2005,2004,2003,2002,2001,2000,1999,1998,1997,1996,1995,1994,1993,1992,1991,1990,1989,1988,1987,1986,1985,1984,1983,1982,1981,1980,1979,1978,1977,1976,1975,1974,1973,1972,1971,1970,1969,1968,1967,1966,1965,1964,1963,1962
This statistics in other country:
AfghanistanAlbaniaAlgeriaAndorraAngolaAntigua and BarbudaArab WorldArgentinaArmeniaArubaAustraliaAustriaAzerbaijanBahamas, TheBahrainBangladeshBarbadosBelarusBelgiumBelizeBeninBermudaBhutanBoliviaBosnia and HerzegovinaBotswanaBrazilBrunei DarussalamBulgariaBurkina FasoBurundiCabo VerdeCambodiaCameroonCanadaCaribbean small statesCayman IslandsCentral African RepublicCentral Europe and the BalticsChadChannel IslandsChileChinaColombiaComorosCongo, Dem. Rep.Congo, Rep.Costa RicaCote d'IvoireCroatiaCubaCyprusCzech RepublicDenmarkDjiboutiDominicaDominican RepublicEarly-demographic dividendEast Asia & PacificEast Asia & Pacific (excluding high income)East Asia & Pacific (IDA & IBRD countries)EcuadorEgypt, Arab Rep.El SalvadorEquatorial GuineaEritreaEstoniaEthiopiaEuro areaEurope & Central AsiaEurope & Central Asia (excluding high income)Europe & Central Asia (IDA & IBRD countries)European UnionFijiFinlandFragile and conflict affected situationsFranceFrench PolynesiaGabonGambia, TheGeorgiaGermanyGhanaGreeceGreenlandGrenadaGuatemalaGuineaGuinea-BissauGuyanaHaitiHeavily indebted poor countries (HIPC)High incomeHondurasHong Kong SAR, ChinaHungaryIBRD onlyIcelandIDA & IBRD totalIDA blendIDA onlyIDA totalIndiaIndonesiaIran, Islamic Rep.IraqIrelandIsle of ManIsraelItalyJamaicaJapanJordanKazakhstanKenyaKiribatiKorea, Rep.KosovoKuwaitKyrgyz RepublicLao PDRLate-demographic dividendLatin America & Caribbean Latin America & Caribbean (excluding high income)Latin America & the Caribbean (IDA & IBRD countries)LatviaLeast developed countries: UN classificationLebanonLesothoLiberiaLibyaLiechtensteinLithuaniaLow & middle incomeLow incomeLower middle incomeLuxembourgMacao SAR, ChinaMacedonia, FYRMadagascarMalawiMalaysiaMaldivesMaliMaltaMarshall IslandsMauritaniaMauritiusMexicoMicronesia, Fed. Sts.Middle East & North AfricaMiddle East & North Africa (excluding high income)Middle East & North Africa (IDA & IBRD countries)Middle incomeMoldovaMonacoMongoliaMontenegroMoroccoMozambiqueMyanmarNamibiaNauruNepalNetherlandsNew CaledoniaNew ZealandNicaraguaNigerNigeriaNorth AmericaNorwayOECD membersOmanOther small statesPacific island small statesPakistanPalauPanamaPapua New GuineaParaguayPeruPhilippinesPolandPortugalPost-demographic dividendPre-demographic dividendPuerto RicoQatarRomaniaRussian FederationRwandaSamoaSan MarinoSao Tome and PrincipeSaudi ArabiaSenegalSerbiaSeychellesSierra LeoneSingaporeSlovak RepublicSloveniaSmall statesSolomon IslandsSomaliaSouth AfricaSouth AsiaSouth Asia (IDA & IBRD)South SudanSpainSri LankaSt. Kitts and NevisSt. LuciaSt. Vincent and the GrenadinesSub-Saharan Africa Sub-Saharan Africa (excluding high income)Sub-Saharan Africa (IDA & IBRD countries)SudanSurinameSwazilandSwedenSwitzerlandSyrian Arab RepublicTajikistanTanzaniaThailandTimor-LesteTogoTongaTrinidad and TobagoTunisiaTurkeyTurkmenistanTuvaluUgandaUkraineUnited Arab EmiratesUnited KingdomUnited StatesUpper middle incomeUruguayUzbekistanVanuatuVenezuela, RBVietnamVirgin Islands (U.S.)West Bank and GazaWorldYemen, Rep.ZambiaZimbabwe Timeline:
This timeline shows a graph from 1962 to 2016 of Sub-Saharan Africa (excluding high income). No data until 1961. Number of actual observations by date: 55.
Source name:
World Development Indicators
Source organization:
World Bank national accounts data, and OECD National Accounts data files.
Categories, topics:
Economy & Growth
Last updated:
apr 23, 2017
Indicators value changes by year
Minimum:
-1.463
jan 1, 1984
At the date of observation
Value
Absolute change
Change from previous value
jan 1, 1962
1.483
+1.483
0.0%
jan 1, 1963
5.847
+4.363
294.12%
jan 1, 1964
6.3
+0.454
7.76%
jan 1, 1965
5.383
-0.917
-14.56%
jan 1, 1966
6.043
+0.66
12.26%
jan 1, 1967
1.613
-4.431
-73.31%
jan 1, 1968
-0.36
-1.972
-122.31%
jan 1, 1969
3.047
+3.407
-947.11%
jan 1, 1970
8.94
+5.893
193.36%
jan 1, 1971
9.857
+0.917
10.26%
jan 1, 1972
7.442
-2.415
-24.5%
jan 1, 1973
2.66
-4.782
-64.26%
jan 1, 1974
4.344
+1.684
63.33%
jan 1, 1975
7.892
+3.548
81.67%
jan 1, 1976
-0.041
-7.933
-100.52%
jan 1, 1977
5.269
+5.31
-13.02K%
jan 1, 1978
2.366
-2.903
-55.1%
jan 1, 1979
-0.26
-2.626
-111.0%
jan 1, 1980
4.026
+4.286
-1.65K%
jan 1, 1981
4.01
-0.016
-0.39%
jan 1, 1982
-0.135
-4.145
-103.37%
jan 1, 1983
0.23
+0.365
-270.14%
jan 1, 1984
-1.463
-1.693
-736.5%
jan 1, 1985
2.135
+3.598
-245.96%
jan 1, 1986
2.214
+0.078
3.67%
jan 1, 1987
-0.419
-2.633
-118.93%
jan 1, 1988
0.064
+0.483
-115.25%
jan 1, 1989
4.425
+4.361
6.82K%
jan 1, 1990
3.276
-1.149
-25.97%
jan 1, 1991
2.411
-0.865
-26.4%
jan 1, 1992
0.06
-2.351
-97.52%
jan 1, 1993
-1.423
-1.483
-2.48K%
jan 1, 1994
-0.044
+1.379
-96.89%
jan 1, 1995
1.912
+1.956
-4.42K%
jan 1, 1996
3.229
+1.317
68.91%
jan 1, 1997
5.263
+2.033
62.97%
jan 1, 1998
3.626
-1.636
-31.1%
jan 1, 1999
2.49
-1.136
-31.33%
jan 1, 2000
2.201
-0.289
-11.61%
jan 1, 2001
3.627
+1.426
64.77%
jan 1, 2002
3.946
+0.319
8.79%
jan 1, 2003
2.976
-0.97
-24.58%
jan 1, 2004
4.885
+1.909
64.14%
jan 1, 2005
11.66
+6.775
138.69%
jan 1, 2006
5.55
-6.11
-52.4%
jan 1, 2007
7.049
+1.499
27.02%
jan 1, 2008
7.068
+0.019
0.27%
jan 1, 2009
5.399
-1.669
-23.62%
jan 1, 2010
2.857
-2.542
-47.09%
jan 1, 2011
5.394
+2.538
88.83%
jan 1, 2012
4.322
-1.073
-19.88%
jan 1, 2013
3.717
-0.604
-13.99%
jan 1, 2014
4.762
+1.044
28.1%
jan 1, 2015
4.593
-0.169
-3.55%
jan 1, 2016
3.013
-1.58
-34.4%
Ranking of countries by current statistics by years


Comments: