29
/
en
AIzaSyAYiBZKx7MnpbEhh9jyipgxe19OcubqV5w
April 1, 2024
109666
Congo, Dem. Rep.
COD
true
2
1
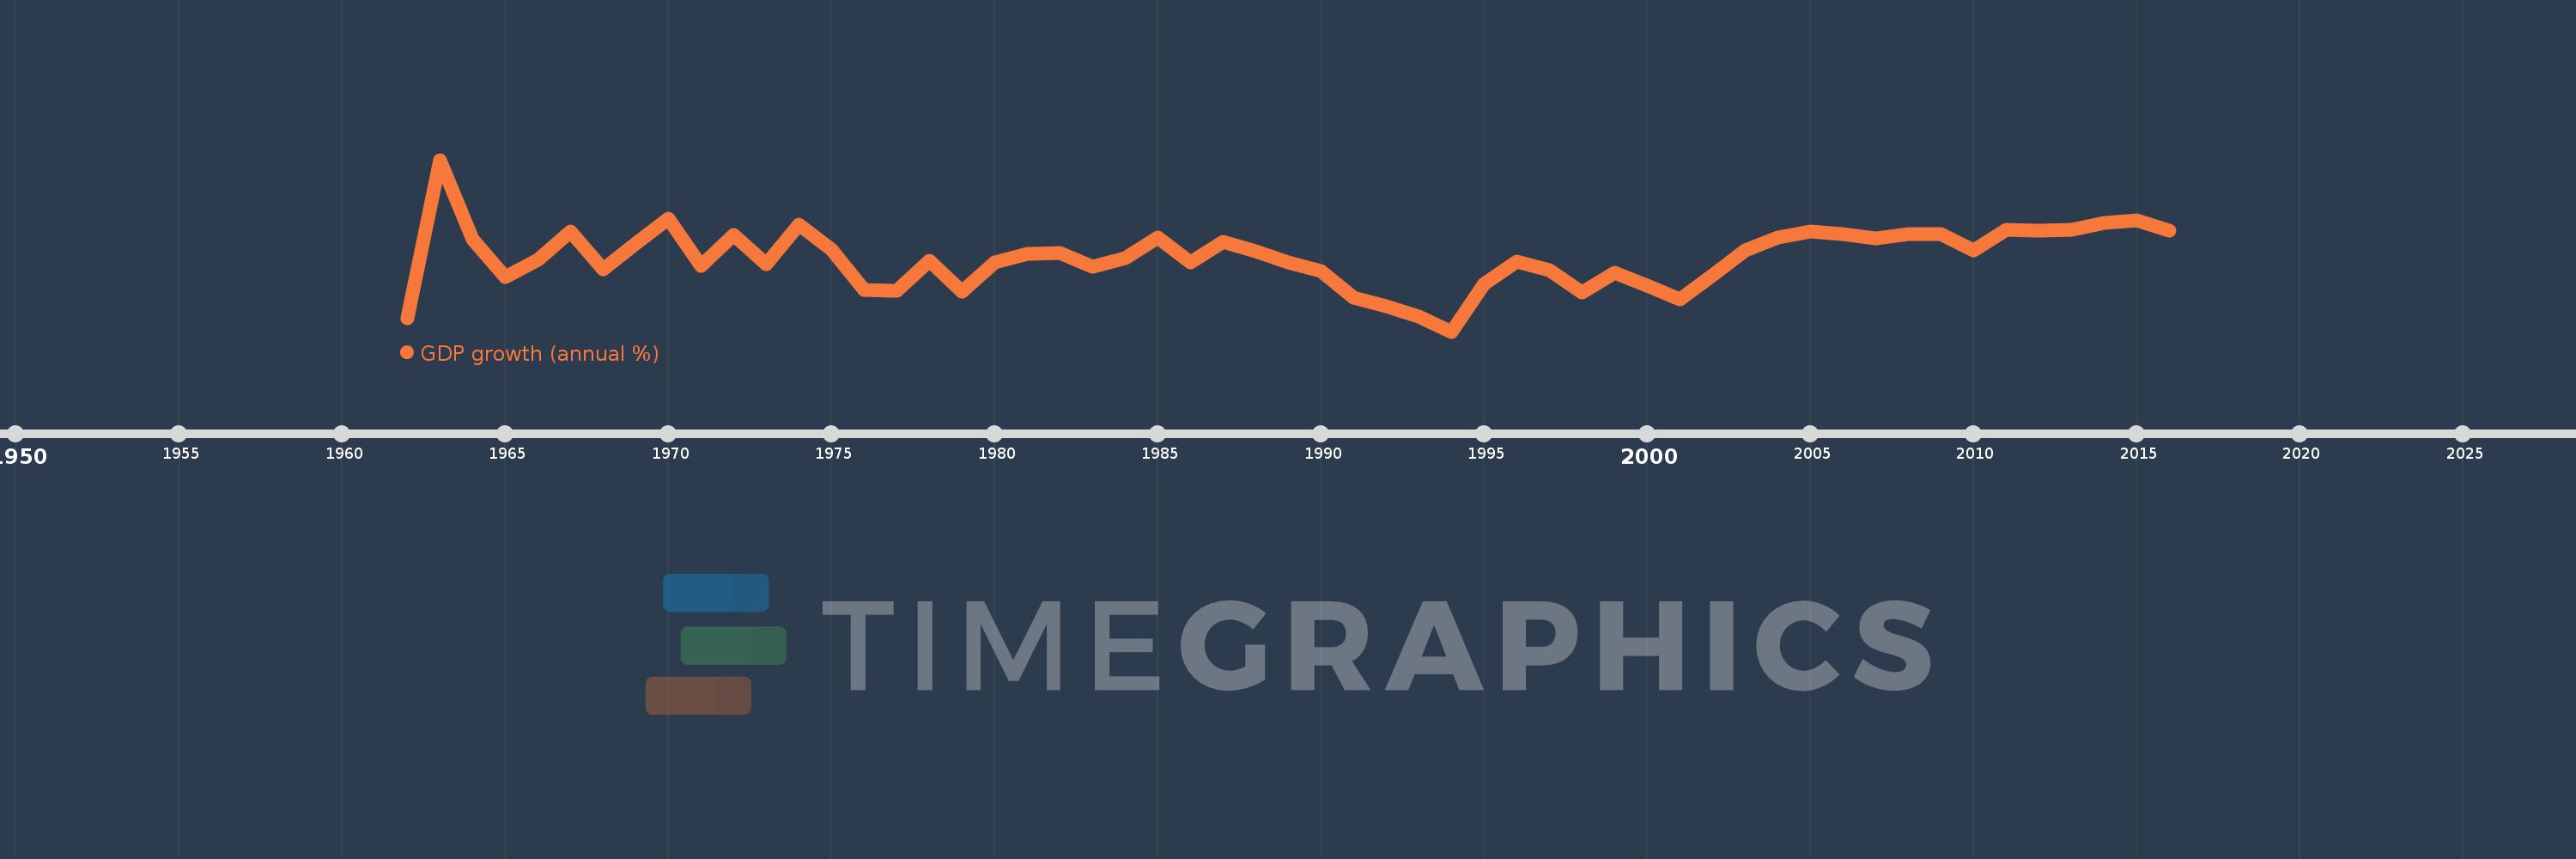
GDP growth (annual %)
2016,2015,2014,2013,2012,2011,2010,2009,2008,2007,2006,2005,2004,2003,2002,2001,2000,1999,1998,1997,1996,1995,1994,1993,1992,1991,1990,1989,1988,1987,1986,1985,1984,1983,1982,1981,1980,1979,1978,1977,1976,1975,1974,1973,1972,1971,1970,1969,1968,1967,1966,1965,1964,1963,1962
This statistics in other country:
AfghanistanAlbaniaAlgeriaAndorraAngolaAntigua and BarbudaArab WorldArgentinaArmeniaArubaAustraliaAustriaAzerbaijanBahamas, TheBahrainBangladeshBarbadosBelarusBelgiumBelizeBeninBermudaBhutanBoliviaBosnia and HerzegovinaBotswanaBrazilBrunei DarussalamBulgariaBurkina FasoBurundiCabo VerdeCambodiaCameroonCanadaCaribbean small statesCayman IslandsCentral African RepublicCentral Europe and the BalticsChadChannel IslandsChileChinaColombiaComorosCongo, Dem. Rep.Congo, Rep.Costa RicaCote d'IvoireCroatiaCubaCyprusCzech RepublicDenmarkDjiboutiDominicaDominican RepublicEarly-demographic dividendEast Asia & PacificEast Asia & Pacific (excluding high income)East Asia & Pacific (IDA & IBRD countries)EcuadorEgypt, Arab Rep.El SalvadorEquatorial GuineaEritreaEstoniaEthiopiaEuro areaEurope & Central AsiaEurope & Central Asia (excluding high income)Europe & Central Asia (IDA & IBRD countries)European UnionFijiFinlandFragile and conflict affected situationsFranceFrench PolynesiaGabonGambia, TheGeorgiaGermanyGhanaGreeceGreenlandGrenadaGuatemalaGuineaGuinea-BissauGuyanaHaitiHeavily indebted poor countries (HIPC)High incomeHondurasHong Kong SAR, ChinaHungaryIBRD onlyIcelandIDA & IBRD totalIDA blendIDA onlyIDA totalIndiaIndonesiaIran, Islamic Rep.IraqIrelandIsle of ManIsraelItalyJamaicaJapanJordanKazakhstanKenyaKiribatiKorea, Rep.KosovoKuwaitKyrgyz RepublicLao PDRLate-demographic dividendLatin America & Caribbean Latin America & Caribbean (excluding high income)Latin America & the Caribbean (IDA & IBRD countries)LatviaLeast developed countries: UN classificationLebanonLesothoLiberiaLibyaLiechtensteinLithuaniaLow & middle incomeLow incomeLower middle incomeLuxembourgMacao SAR, ChinaMacedonia, FYRMadagascarMalawiMalaysiaMaldivesMaliMaltaMarshall IslandsMauritaniaMauritiusMexicoMicronesia, Fed. Sts.Middle East & North AfricaMiddle East & North Africa (excluding high income)Middle East & North Africa (IDA & IBRD countries)Middle incomeMoldovaMonacoMongoliaMontenegroMoroccoMozambiqueMyanmarNamibiaNauruNepalNetherlandsNew CaledoniaNew ZealandNicaraguaNigerNigeriaNorth AmericaNorwayOECD membersOmanOther small statesPacific island small statesPakistanPalauPanamaPapua New GuineaParaguayPeruPhilippinesPolandPortugalPost-demographic dividendPre-demographic dividendPuerto RicoQatarRomaniaRussian FederationRwandaSamoaSan MarinoSao Tome and PrincipeSaudi ArabiaSenegalSerbiaSeychellesSierra LeoneSingaporeSlovak RepublicSloveniaSmall statesSolomon IslandsSomaliaSouth AfricaSouth AsiaSouth Asia (IDA & IBRD)South SudanSpainSri LankaSt. Kitts and NevisSt. LuciaSt. Vincent and the GrenadinesSub-Saharan Africa Sub-Saharan Africa (excluding high income)Sub-Saharan Africa (IDA & IBRD countries)SudanSurinameSwazilandSwedenSwitzerlandSyrian Arab RepublicTajikistanTanzaniaThailandTimor-LesteTogoTongaTrinidad and TobagoTunisiaTurkeyTurkmenistanTuvaluUgandaUkraineUnited Arab EmiratesUnited KingdomUnited StatesUpper middle incomeUruguayUzbekistanVanuatuVenezuela, RBVietnamVirgin Islands (U.S.)West Bank and GazaWorldYemen, Rep.ZambiaZimbabwe Timeline:
This timeline shows a graph from 1962 to 2016 of Congo, Dem. Rep.. No data until 1961. Number of actual observations by date: 55.
Source name:
World Development Indicators
Source organization:
World Bank national accounts data, and OECD National Accounts data files.
Categories, topics:
Economy & Growth
Last updated:
apr 23, 2017
Indicators value changes by year
Minimum:
-13.469
jan 1, 1994
Maximum:
21.201
jan 1, 1963
At the date of observation
Value
Absolute change
Change from previous value
jan 1, 1962
-10.851
-10.851
0.0%
jan 1, 1963
21.201
+32.052
-295.37%
jan 1, 1964
5.214
-15.987
-75.41%
jan 1, 1965
-2.44
-7.654
-146.8%
jan 1, 1966
0.997
+3.438
-140.87%
jan 1, 1967
6.775
+5.778
579.35%
jan 1, 1968
-0.986
-7.761
-114.55%
jan 1, 1969
4.333
+5.318
-539.54%
jan 1, 1970
9.329
+4.996
115.31%
jan 1, 1971
-0.245
-9.574
-102.63%
jan 1, 1972
6.005
+6.25
-2.55K%
jan 1, 1973
0.151
-5.854
-97.48%
jan 1, 1974
8.137
+7.986
5.28K%
jan 1, 1975
3.131
-5.007
-61.53%
jan 1, 1976
-4.982
-8.112
-259.13%
jan 1, 1977
-5.309
-0.327
6.57%
jan 1, 1978
0.761
+6.07
-114.33%
jan 1, 1979
-5.345
-6.106
-802.59%
jan 1, 1980
0.43
+5.775
-108.05%
jan 1, 1981
2.195
+1.765
410.34%
jan 1, 1982
2.351
+0.156
7.09%
jan 1, 1983
-0.458
-2.808
-119.47%
jan 1, 1984
1.412
+1.869
-408.45%
jan 1, 1985
5.541
+4.129
292.51%
jan 1, 1986
0.468
-5.073
-91.56%
jan 1, 1987
4.717
+4.249
908.27%
jan 1, 1988
2.676
-2.042
-43.28%
jan 1, 1989
0.47
-2.205
-82.42%
jan 1, 1990
-1.266
-1.736
-369.15%
jan 1, 1991
-6.568
-5.302
418.8%
jan 1, 1992
-8.421
-1.853
28.21%
jan 1, 1993
-10.5
-2.079
24.69%
jan 1, 1994
-13.469
-2.969
28.28%
jan 1, 1995
-3.9
+9.569
-71.04%
jan 1, 1996
0.7
+4.6
-117.95%
jan 1, 1997
-1.023
-1.723
-246.17%
jan 1, 1998
-5.617
-4.594
448.98%
jan 1, 1999
-1.624
+3.993
-71.09%
jan 1, 2000
-4.27
-2.646
162.91%
jan 1, 2001
-6.911
-2.641
61.84%
jan 1, 2002
-2.1
+4.811
-69.61%
jan 1, 2003
2.948
+5.048
-240.36%
jan 1, 2004
5.578
+2.63
89.22%
jan 1, 2005
6.738
+1.161
20.81%
jan 1, 2006
6.135
-0.603
-8.95%
jan 1, 2007
5.321
-0.814
-13.27%
jan 1, 2008
6.259
+0.938
17.64%
jan 1, 2009
6.226
-0.034
-0.54%
jan 1, 2010
2.855
-3.371
-54.14%
jan 1, 2011
7.079
+4.224
147.94%
jan 1, 2012
6.865
-0.214
-3.03%
jan 1, 2013
7.158
+0.293
4.27%
jan 1, 2014
8.504
+1.346
18.8%
jan 1, 2015
8.969
+0.466
5.48%
jan 1, 2016
6.916
-2.053
-22.89%
Ranking of countries by current statistics by years


Comments: