29
/
en
AIzaSyAYiBZKx7MnpbEhh9jyipgxe19OcubqV5w
April 1, 2024
72969
Australia
AUS
true
2
1
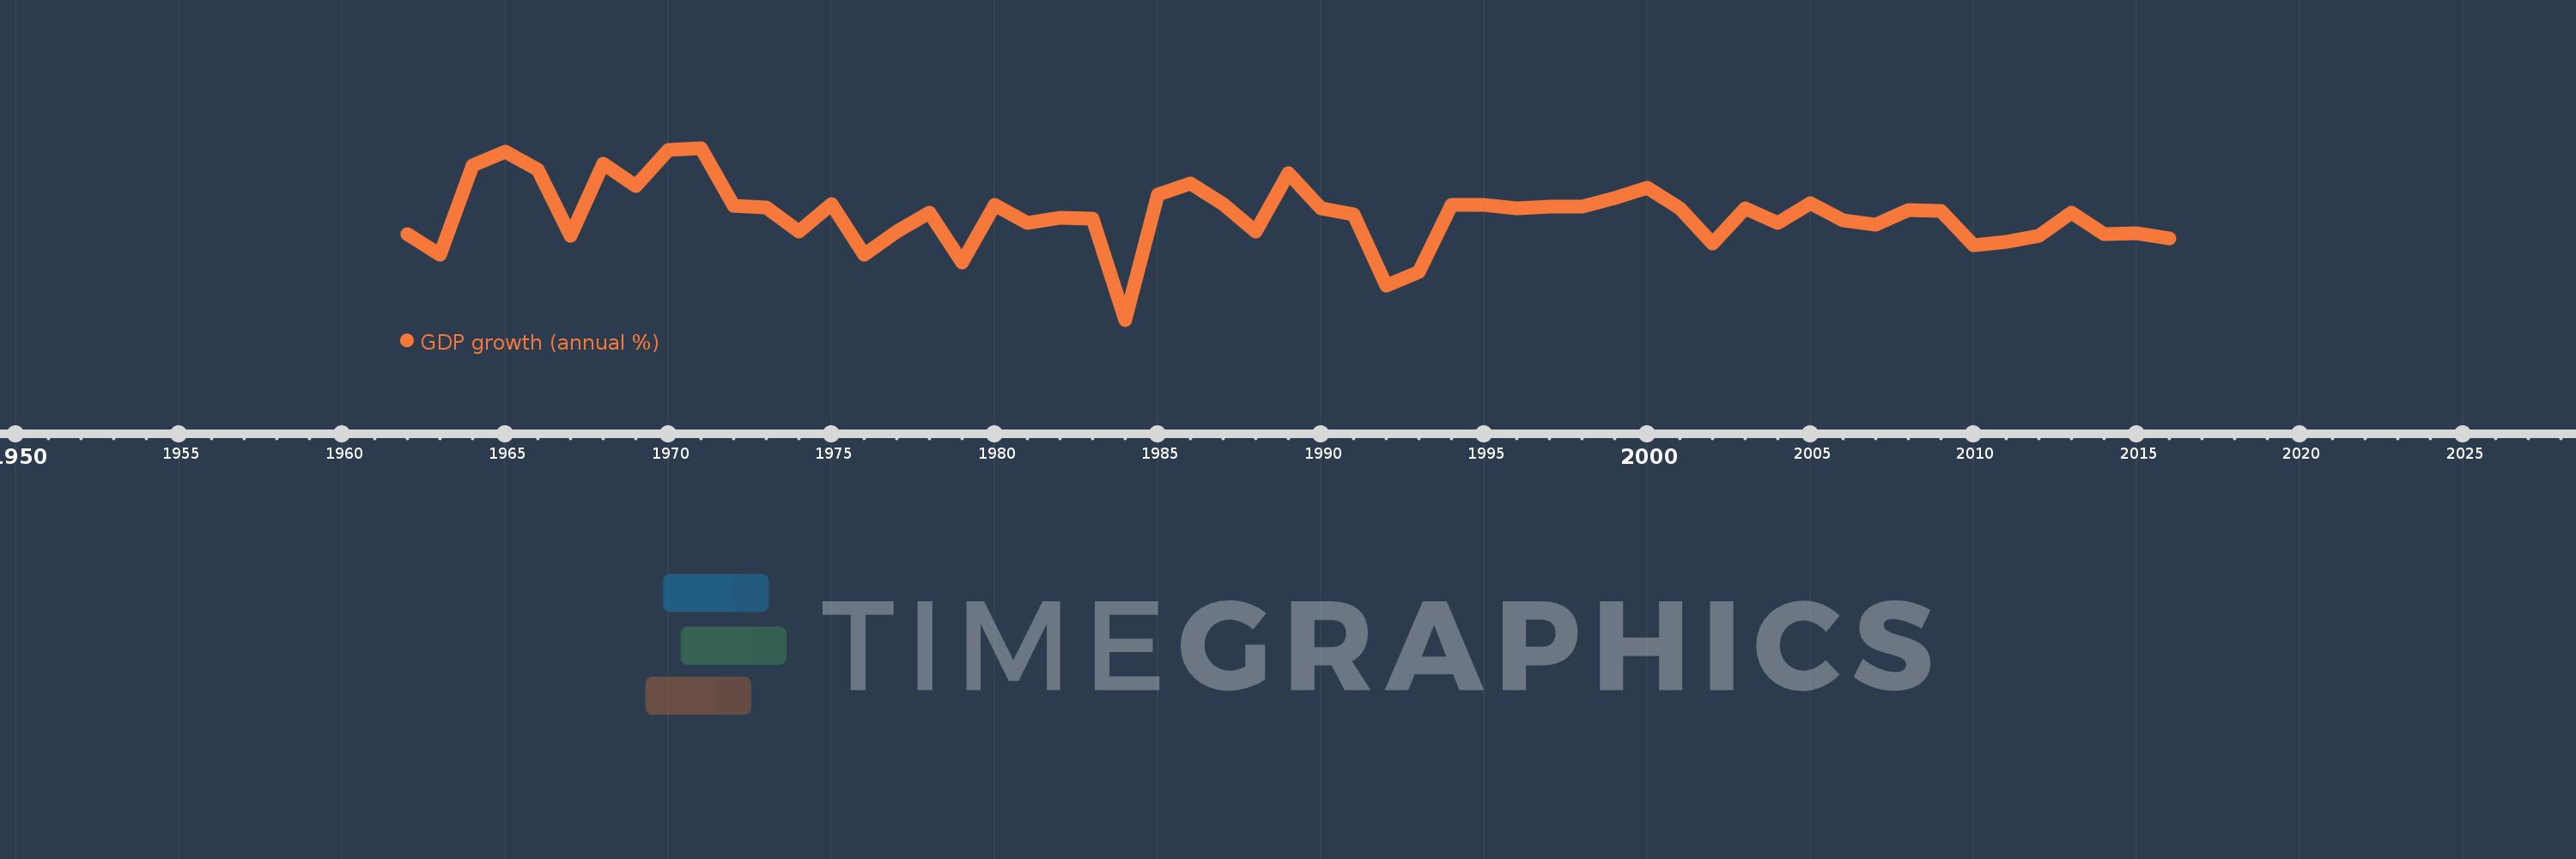
GDP growth (annual %)
2016,2015,2014,2013,2012,2011,2010,2009,2008,2007,2006,2005,2004,2003,2002,2001,2000,1999,1998,1997,1996,1995,1994,1993,1992,1991,1990,1989,1988,1987,1986,1985,1984,1983,1982,1981,1980,1979,1978,1977,1976,1975,1974,1973,1972,1971,1970,1969,1968,1967,1966,1965,1964,1963,1962
This statistics in other country:
AfghanistanAlbaniaAlgeriaAndorraAngolaAntigua and BarbudaArab WorldArgentinaArmeniaArubaAustraliaAustriaAzerbaijanBahamas, TheBahrainBangladeshBarbadosBelarusBelgiumBelizeBeninBermudaBhutanBoliviaBosnia and HerzegovinaBotswanaBrazilBrunei DarussalamBulgariaBurkina FasoBurundiCabo VerdeCambodiaCameroonCanadaCaribbean small statesCayman IslandsCentral African RepublicCentral Europe and the BalticsChadChannel IslandsChileChinaColombiaComorosCongo, Dem. Rep.Congo, Rep.Costa RicaCote d'IvoireCroatiaCubaCyprusCzech RepublicDenmarkDjiboutiDominicaDominican RepublicEarly-demographic dividendEast Asia & PacificEast Asia & Pacific (excluding high income)East Asia & Pacific (IDA & IBRD countries)EcuadorEgypt, Arab Rep.El SalvadorEquatorial GuineaEritreaEstoniaEthiopiaEuro areaEurope & Central AsiaEurope & Central Asia (excluding high income)Europe & Central Asia (IDA & IBRD countries)European UnionFijiFinlandFragile and conflict affected situationsFranceFrench PolynesiaGabonGambia, TheGeorgiaGermanyGhanaGreeceGreenlandGrenadaGuatemalaGuineaGuinea-BissauGuyanaHaitiHeavily indebted poor countries (HIPC)High incomeHondurasHong Kong SAR, ChinaHungaryIBRD onlyIcelandIDA & IBRD totalIDA blendIDA onlyIDA totalIndiaIndonesiaIran, Islamic Rep.IraqIrelandIsle of ManIsraelItalyJamaicaJapanJordanKazakhstanKenyaKiribatiKorea, Rep.KosovoKuwaitKyrgyz RepublicLao PDRLate-demographic dividendLatin America & Caribbean Latin America & Caribbean (excluding high income)Latin America & the Caribbean (IDA & IBRD countries)LatviaLeast developed countries: UN classificationLebanonLesothoLiberiaLibyaLiechtensteinLithuaniaLow & middle incomeLow incomeLower middle incomeLuxembourgMacao SAR, ChinaMacedonia, FYRMadagascarMalawiMalaysiaMaldivesMaliMaltaMarshall IslandsMauritaniaMauritiusMexicoMicronesia, Fed. Sts.Middle East & North AfricaMiddle East & North Africa (excluding high income)Middle East & North Africa (IDA & IBRD countries)Middle incomeMoldovaMonacoMongoliaMontenegroMoroccoMozambiqueMyanmarNamibiaNauruNepalNetherlandsNew CaledoniaNew ZealandNicaraguaNigerNigeriaNorth AmericaNorwayOECD membersOmanOther small statesPacific island small statesPakistanPalauPanamaPapua New GuineaParaguayPeruPhilippinesPolandPortugalPost-demographic dividendPre-demographic dividendPuerto RicoQatarRomaniaRussian FederationRwandaSamoaSan MarinoSao Tome and PrincipeSaudi ArabiaSenegalSerbiaSeychellesSierra LeoneSingaporeSlovak RepublicSloveniaSmall statesSolomon IslandsSomaliaSouth AfricaSouth AsiaSouth Asia (IDA & IBRD)South SudanSpainSri LankaSt. Kitts and NevisSt. LuciaSt. Vincent and the GrenadinesSub-Saharan Africa Sub-Saharan Africa (excluding high income)Sub-Saharan Africa (IDA & IBRD countries)SudanSurinameSwazilandSwedenSwitzerlandSyrian Arab RepublicTajikistanTanzaniaThailandTimor-LesteTogoTongaTrinidad and TobagoTunisiaTurkeyTurkmenistanTuvaluUgandaUkraineUnited Arab EmiratesUnited KingdomUnited StatesUpper middle incomeUruguayUzbekistanVanuatuVenezuela, RBVietnamVirgin Islands (U.S.)West Bank and GazaWorldYemen, Rep.ZambiaZimbabwe Timeline:
This timeline shows a graph from 1962 to 2016 of Australia. No data until 1961. Number of actual observations by date: 55.
Source name:
World Development Indicators
Source organization:
World Bank national accounts data, and OECD National Accounts data files.
Categories, topics:
Economy & Growth
Last updated:
apr 23, 2017
Indicators value changes by year
Minimum:
-2.231
jan 1, 1984
At the date of observation
Value
Absolute change
Change from previous value
jan 1, 1962
2.476
+2.476
0.0%
jan 1, 1963
1.328
-1.148
-46.38%
jan 1, 1964
6.212
+4.885
367.95%
jan 1, 1965
6.976
+0.764
12.29%
jan 1, 1966
5.98
-0.996
-14.28%
jan 1, 1967
2.365
-3.615
-60.45%
jan 1, 1968
6.297
+3.932
166.24%
jan 1, 1969
5.093
-1.204
-19.12%
jan 1, 1970
7.05
+1.957
38.42%
jan 1, 1971
7.167
+0.117
1.66%
jan 1, 1972
4.009
-3.158
-44.06%
jan 1, 1973
3.911
-0.098
-2.45%
jan 1, 1974
2.599
-1.312
-33.55%
jan 1, 1975
4.097
+1.498
57.65%
jan 1, 1976
1.338
-2.759
-67.33%
jan 1, 1977
2.59
+1.251
93.51%
jan 1, 1978
3.607
+1.018
39.3%
jan 1, 1979
0.897
-2.71
-75.13%
jan 1, 1980
4.053
+3.156
351.83%
jan 1, 1981
3.051
-1.001
-24.71%
jan 1, 1982
3.358
+0.307
10.05%
jan 1, 1983
3.321
-0.037
-1.1%
jan 1, 1984
-2.231
-5.552
-167.16%
jan 1, 1985
4.627
+6.858
-307.44%
jan 1, 1986
5.249
+0.622
13.45%
jan 1, 1987
4.102
-1.148
-21.87%
jan 1, 1988
2.574
-1.527
-37.23%
jan 1, 1989
5.769
+3.195
124.08%
jan 1, 1990
3.879
-1.89
-32.77%
jan 1, 1991
3.529
-0.35
-9.01%
jan 1, 1992
-0.38
-3.909
-110.76%
jan 1, 1993
0.399
+0.779
-205.03%
jan 1, 1994
4.06
+3.661
917.56%
jan 1, 1995
4.038
-0.022
-0.55%
jan 1, 1996
3.879
-0.159
-3.94%
jan 1, 1997
3.949
+0.07
1.81%
jan 1, 1998
3.947
-0.002
-0.05%
jan 1, 1999
4.438
+0.491
12.44%
jan 1, 2000
5.007
+0.569
12.82%
jan 1, 2001
3.869
-1.138
-22.74%
jan 1, 2002
1.929
-1.939
-50.13%
jan 1, 2003
3.857
+1.927
99.89%
jan 1, 2004
3.071
-0.786
-20.38%
jan 1, 2005
4.149
+1.079
35.12%
jan 1, 2006
3.207
-0.943
-22.72%
jan 1, 2007
2.983
-0.224
-6.98%
jan 1, 2008
3.758
+0.775
25.97%
jan 1, 2009
3.707
-0.051
-1.36%
jan 1, 2010
1.82
-1.887
-50.91%
jan 1, 2011
2.018
+0.199
10.91%
jan 1, 2012
2.38
+0.361
17.91%
jan 1, 2013
3.633
+1.253
52.66%
jan 1, 2014
2.44
-1.193
-32.83%
jan 1, 2015
2.5
+0.06
2.45%
jan 1, 2016
2.24
-0.26
-10.39%
Ranking of countries by current statistics by years


Comments: