29
/
en
AIzaSyAYiBZKx7MnpbEhh9jyipgxe19OcubqV5w
April 1, 2024
159406
Ireland
IRL
true
2
1
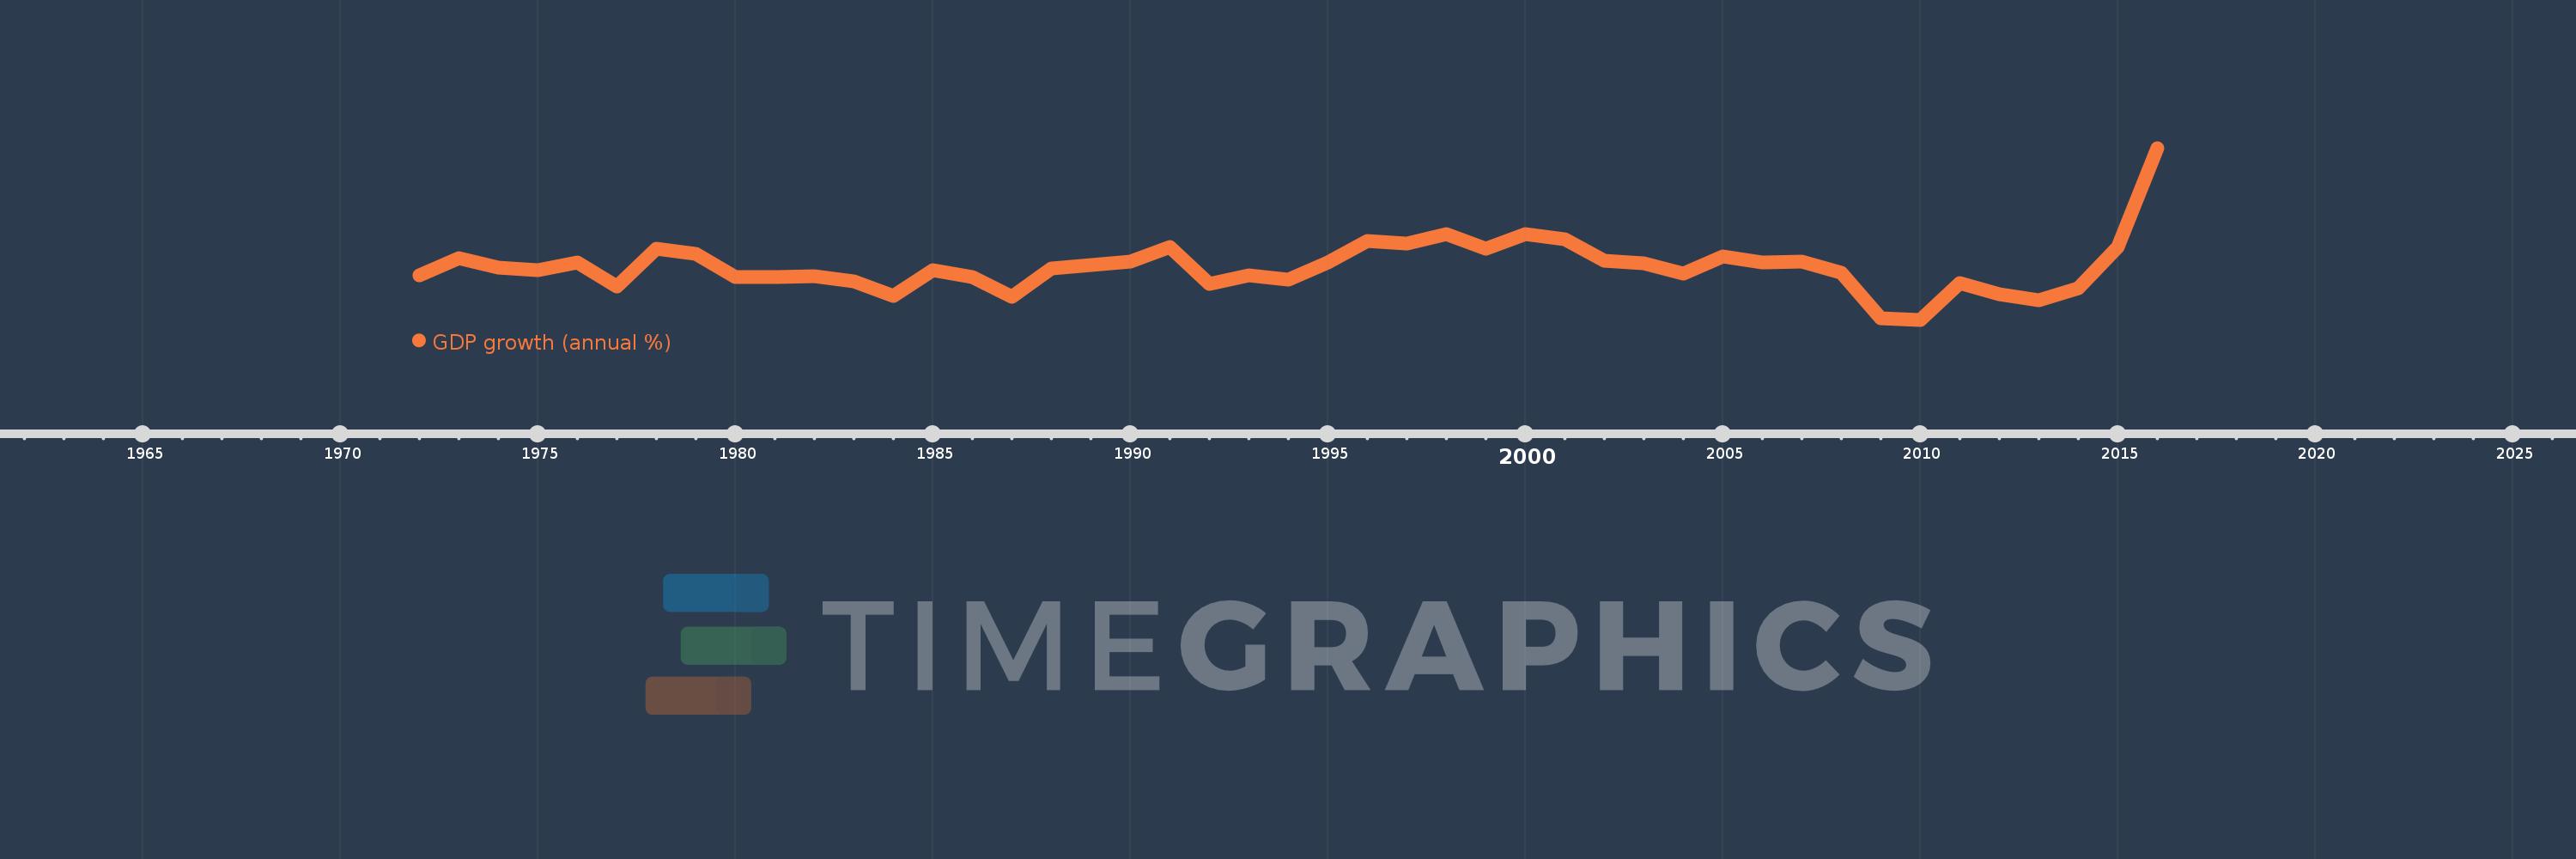
GDP growth (annual %)
2016,2015,2014,2013,2012,2011,2010,2009,2008,2007,2006,2005,2004,2003,2002,2001,2000,1999,1998,1997,1996,1995,1994,1993,1992,1991,1990,1989,1988,1987,1986,1985,1984,1983,1982,1981,1980,1979,1978,1977,1976,1975,1974,1973,1972
This statistics in other country:
AfghanistanAlbaniaAlgeriaAndorraAngolaAntigua and BarbudaArab WorldArgentinaArmeniaArubaAustraliaAustriaAzerbaijanBahamas, TheBahrainBangladeshBarbadosBelarusBelgiumBelizeBeninBermudaBhutanBoliviaBosnia and HerzegovinaBotswanaBrazilBrunei DarussalamBulgariaBurkina FasoBurundiCabo VerdeCambodiaCameroonCanadaCaribbean small statesCayman IslandsCentral African RepublicCentral Europe and the BalticsChadChannel IslandsChileChinaColombiaComorosCongo, Dem. Rep.Congo, Rep.Costa RicaCote d'IvoireCroatiaCubaCyprusCzech RepublicDenmarkDjiboutiDominicaDominican RepublicEarly-demographic dividendEast Asia & PacificEast Asia & Pacific (excluding high income)East Asia & Pacific (IDA & IBRD countries)EcuadorEgypt, Arab Rep.El SalvadorEquatorial GuineaEritreaEstoniaEthiopiaEuro areaEurope & Central AsiaEurope & Central Asia (excluding high income)Europe & Central Asia (IDA & IBRD countries)European UnionFijiFinlandFragile and conflict affected situationsFranceFrench PolynesiaGabonGambia, TheGeorgiaGermanyGhanaGreeceGreenlandGrenadaGuatemalaGuineaGuinea-BissauGuyanaHaitiHeavily indebted poor countries (HIPC)High incomeHondurasHong Kong SAR, ChinaHungaryIBRD onlyIcelandIDA & IBRD totalIDA blendIDA onlyIDA totalIndiaIndonesiaIran, Islamic Rep.IraqIrelandIsle of ManIsraelItalyJamaicaJapanJordanKazakhstanKenyaKiribatiKorea, Rep.KosovoKuwaitKyrgyz RepublicLao PDRLate-demographic dividendLatin America & Caribbean Latin America & Caribbean (excluding high income)Latin America & the Caribbean (IDA & IBRD countries)LatviaLeast developed countries: UN classificationLebanonLesothoLiberiaLibyaLiechtensteinLithuaniaLow & middle incomeLow incomeLower middle incomeLuxembourgMacao SAR, ChinaMacedonia, FYRMadagascarMalawiMalaysiaMaldivesMaliMaltaMarshall IslandsMauritaniaMauritiusMexicoMicronesia, Fed. Sts.Middle East & North AfricaMiddle East & North Africa (excluding high income)Middle East & North Africa (IDA & IBRD countries)Middle incomeMoldovaMonacoMongoliaMontenegroMoroccoMozambiqueMyanmarNamibiaNauruNepalNetherlandsNew CaledoniaNew ZealandNicaraguaNigerNigeriaNorth AmericaNorwayOECD membersOmanOther small statesPacific island small statesPakistanPalauPanamaPapua New GuineaParaguayPeruPhilippinesPolandPortugalPost-demographic dividendPre-demographic dividendPuerto RicoQatarRomaniaRussian FederationRwandaSamoaSan MarinoSao Tome and PrincipeSaudi ArabiaSenegalSerbiaSeychellesSierra LeoneSingaporeSlovak RepublicSloveniaSmall statesSolomon IslandsSomaliaSouth AfricaSouth AsiaSouth Asia (IDA & IBRD)South SudanSpainSri LankaSt. Kitts and NevisSt. LuciaSt. Vincent and the GrenadinesSub-Saharan Africa Sub-Saharan Africa (excluding high income)Sub-Saharan Africa (IDA & IBRD countries)SudanSurinameSwazilandSwedenSwitzerlandSyrian Arab RepublicTajikistanTanzaniaThailandTimor-LesteTogoTongaTrinidad and TobagoTunisiaTurkeyTurkmenistanTuvaluUgandaUkraineUnited Arab EmiratesUnited KingdomUnited StatesUpper middle incomeUruguayUzbekistanVanuatuVenezuela, RBVietnamVirgin Islands (U.S.)West Bank and GazaWorldYemen, Rep.ZambiaZimbabwe Timeline:
This timeline shows a graph from 1972 to 2016 of Ireland. No data until 1971. Number of actual observations by date: 45.
Source name:
World Development Indicators
Source organization:
World Bank national accounts data, and OECD National Accounts data files.
Categories, topics:
Economy & Growth
Last updated:
apr 23, 2017
Indicators value changes by year
Minimum:
-4.565
jan 1, 2010
Maximum:
26.276
jan 1, 2016
At the date of observation
Value
Absolute change
Change from previous value
jan 1, 1972
3.47
+3.47
0.0%
jan 1, 1973
6.49
+3.02
87.03%
jan 1, 1974
4.721
-1.768
-27.25%
jan 1, 1975
4.26
-0.461
-9.77%
jan 1, 1976
5.657
+1.396
32.78%
jan 1, 1977
1.395
-4.262
-75.34%
jan 1, 1978
8.211
+6.816
488.7%
jan 1, 1979
7.187
-1.025
-12.48%
jan 1, 1980
3.073
-4.114
-57.24%
jan 1, 1981
3.079
+0.006
0.2%
jan 1, 1982
3.325
+0.246
7.99%
jan 1, 1983
2.283
-1.042
-31.33%
jan 1, 1984
-0.244
-2.528
-110.7%
jan 1, 1985
4.354
+4.599
-1.88K%
jan 1, 1986
3.086
-1.269
-29.14%
jan 1, 1987
-0.428
-3.514
-113.88%
jan 1, 1988
4.663
+5.091
-1.19K%
jan 1, 1989
5.217
+0.554
11.89%
jan 1, 1990
5.814
+0.597
11.43%
jan 1, 1991
8.467
+2.653
45.63%
jan 1, 1992
1.93
-6.537
-77.21%
jan 1, 1993
3.343
+1.414
73.26%
jan 1, 1994
2.693
-0.651
-19.46%
jan 1, 1995
5.756
+3.063
113.76%
jan 1, 1996
9.634
+3.879
67.39%
jan 1, 1997
9.092
-0.543
-5.63%
jan 1, 1998
10.748
+1.656
18.22%
jan 1, 1999
8.228
-2.52
-23.45%
jan 1, 2000
10.863
+2.635
32.03%
jan 1, 2001
9.911
-0.952
-8.76%
jan 1, 2002
6.052
-3.859
-38.94%
jan 1, 2003
5.577
-0.475
-7.85%
jan 1, 2004
3.673
-1.904
-34.14%
jan 1, 2005
6.725
+3.052
83.08%
jan 1, 2006
5.766
-0.959
-14.26%
jan 1, 2007
5.866
+0.1
1.73%
jan 1, 2008
3.797
-2.069
-35.28%
jan 1, 2009
-4.373
-8.17
-215.19%
jan 1, 2010
-4.565
-0.192
4.38%
jan 1, 2011
2.034
+6.599
-144.55%
jan 1, 2012
-0.041
-2.074
-101.99%
jan 1, 2013
-1.103
-1.062
2.62K%
jan 1, 2014
1.099
+2.202
-199.63%
jan 1, 2015
8.462
+7.364
670.12%
jan 1, 2016
26.276
+17.814
210.5%
Ranking of countries by current statistics by years


Comments: