29
/
en
AIzaSyAYiBZKx7MnpbEhh9jyipgxe19OcubqV5w
April 1, 2024
92581
Brunei Darussalam
BRN
true
2
1
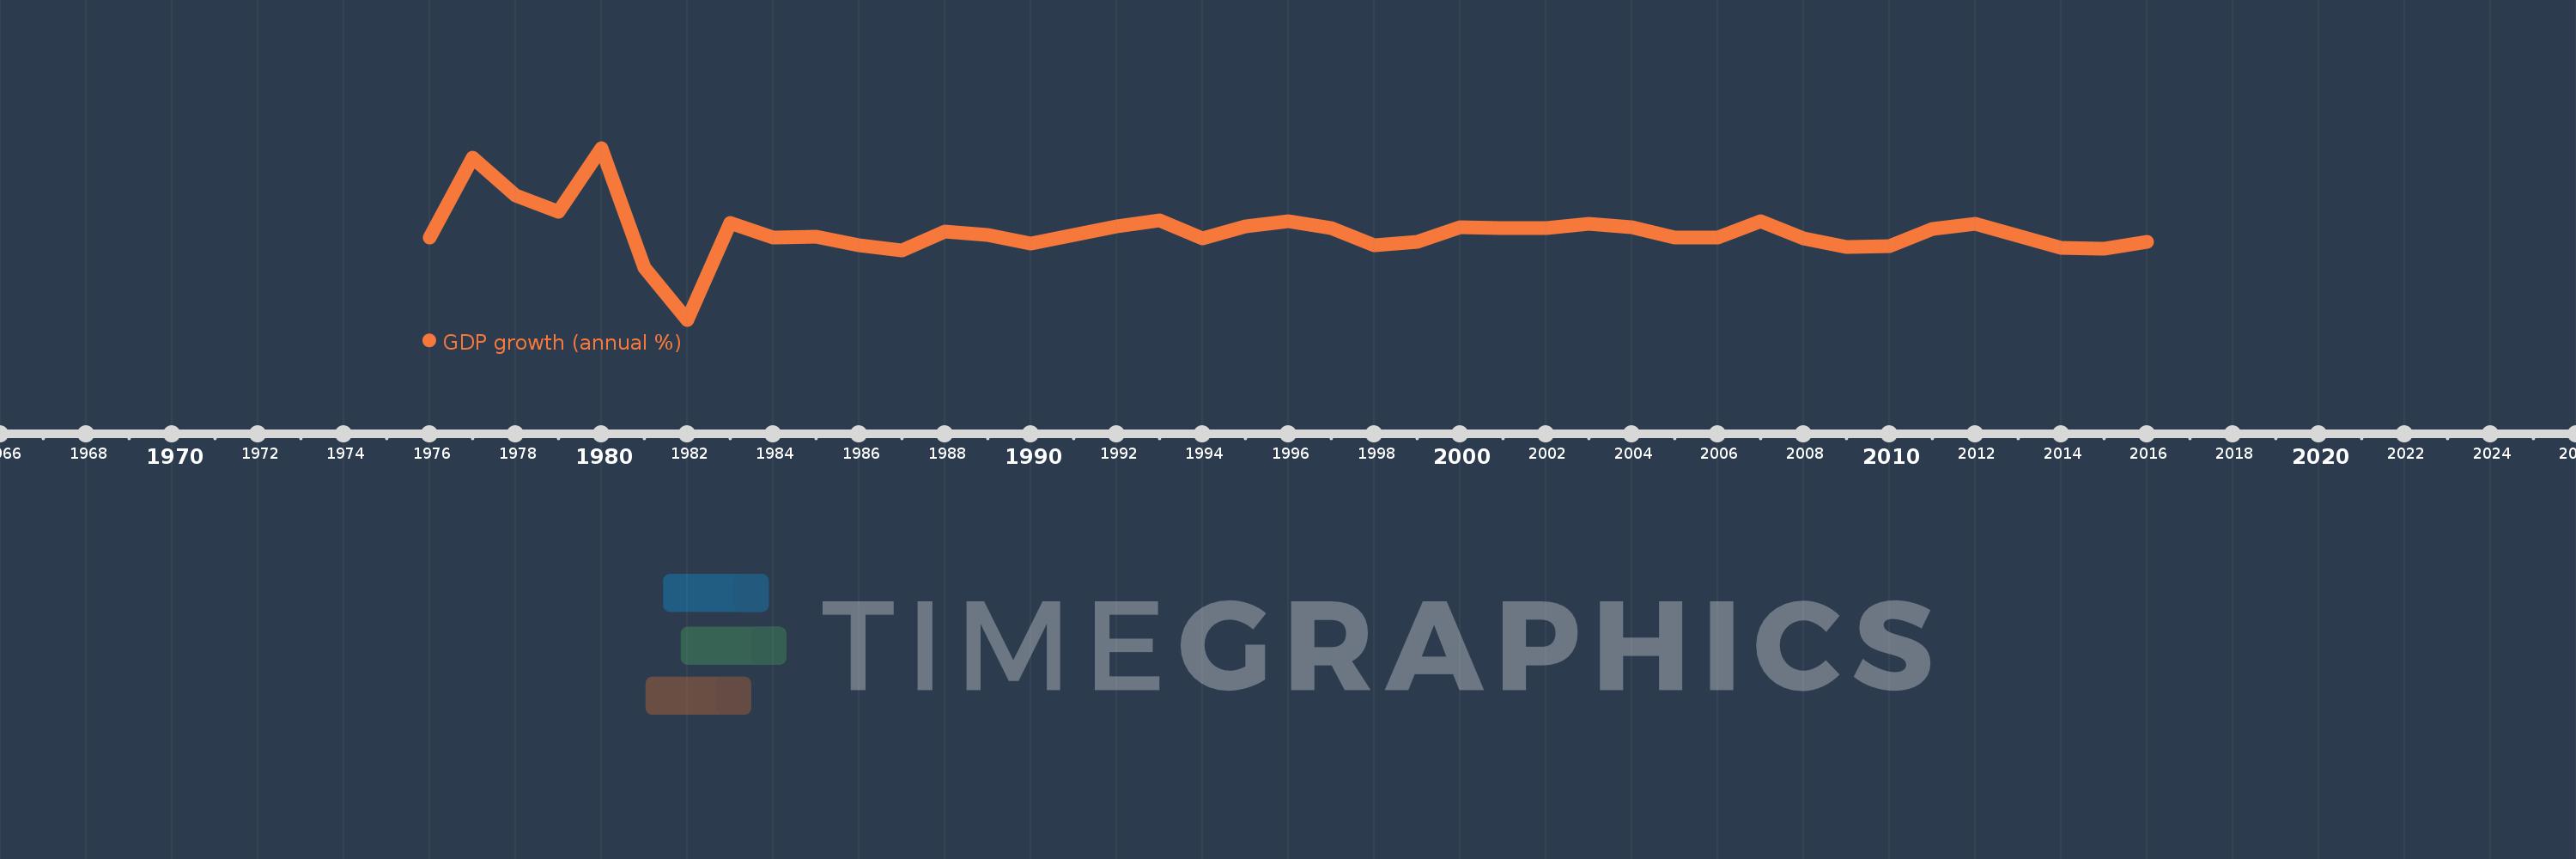
GDP growth (annual %)
2016,2015,2014,2013,2012,2011,2010,2009,2008,2007,2006,2005,2004,2003,2002,2001,2000,1999,1998,1997,1996,1995,1994,1993,1992,1991,1990,1989,1988,1987,1986,1985,1984,1983,1982,1981,1980,1979,1978,1977,1976
This statistics in other country:
AfghanistanAlbaniaAlgeriaAndorraAngolaAntigua and BarbudaArab WorldArgentinaArmeniaArubaAustraliaAustriaAzerbaijanBahamas, TheBahrainBangladeshBarbadosBelarusBelgiumBelizeBeninBermudaBhutanBoliviaBosnia and HerzegovinaBotswanaBrazilBrunei DarussalamBulgariaBurkina FasoBurundiCabo VerdeCambodiaCameroonCanadaCaribbean small statesCayman IslandsCentral African RepublicCentral Europe and the BalticsChadChannel IslandsChileChinaColombiaComorosCongo, Dem. Rep.Congo, Rep.Costa RicaCote d'IvoireCroatiaCubaCyprusCzech RepublicDenmarkDjiboutiDominicaDominican RepublicEarly-demographic dividendEast Asia & PacificEast Asia & Pacific (excluding high income)East Asia & Pacific (IDA & IBRD countries)EcuadorEgypt, Arab Rep.El SalvadorEquatorial GuineaEritreaEstoniaEthiopiaEuro areaEurope & Central AsiaEurope & Central Asia (excluding high income)Europe & Central Asia (IDA & IBRD countries)European UnionFijiFinlandFragile and conflict affected situationsFranceFrench PolynesiaGabonGambia, TheGeorgiaGermanyGhanaGreeceGreenlandGrenadaGuatemalaGuineaGuinea-BissauGuyanaHaitiHeavily indebted poor countries (HIPC)High incomeHondurasHong Kong SAR, ChinaHungaryIBRD onlyIcelandIDA & IBRD totalIDA blendIDA onlyIDA totalIndiaIndonesiaIran, Islamic Rep.IraqIrelandIsle of ManIsraelItalyJamaicaJapanJordanKazakhstanKenyaKiribatiKorea, Rep.KosovoKuwaitKyrgyz RepublicLao PDRLate-demographic dividendLatin America & Caribbean Latin America & Caribbean (excluding high income)Latin America & the Caribbean (IDA & IBRD countries)LatviaLeast developed countries: UN classificationLebanonLesothoLiberiaLibyaLiechtensteinLithuaniaLow & middle incomeLow incomeLower middle incomeLuxembourgMacao SAR, ChinaMacedonia, FYRMadagascarMalawiMalaysiaMaldivesMaliMaltaMarshall IslandsMauritaniaMauritiusMexicoMicronesia, Fed. Sts.Middle East & North AfricaMiddle East & North Africa (excluding high income)Middle East & North Africa (IDA & IBRD countries)Middle incomeMoldovaMonacoMongoliaMontenegroMoroccoMozambiqueMyanmarNamibiaNauruNepalNetherlandsNew CaledoniaNew ZealandNicaraguaNigerNigeriaNorth AmericaNorwayOECD membersOmanOther small statesPacific island small statesPakistanPalauPanamaPapua New GuineaParaguayPeruPhilippinesPolandPortugalPost-demographic dividendPre-demographic dividendPuerto RicoQatarRomaniaRussian FederationRwandaSamoaSan MarinoSao Tome and PrincipeSaudi ArabiaSenegalSerbiaSeychellesSierra LeoneSingaporeSlovak RepublicSloveniaSmall statesSolomon IslandsSomaliaSouth AfricaSouth AsiaSouth Asia (IDA & IBRD)South SudanSpainSri LankaSt. Kitts and NevisSt. LuciaSt. Vincent and the GrenadinesSub-Saharan Africa Sub-Saharan Africa (excluding high income)Sub-Saharan Africa (IDA & IBRD countries)SudanSurinameSwazilandSwedenSwitzerlandSyrian Arab RepublicTajikistanTanzaniaThailandTimor-LesteTogoTongaTrinidad and TobagoTunisiaTurkeyTurkmenistanTuvaluUgandaUkraineUnited Arab EmiratesUnited KingdomUnited StatesUpper middle incomeUruguayUzbekistanVanuatuVenezuela, RBVietnamVirgin Islands (U.S.)West Bank and GazaWorldYemen, Rep.ZambiaZimbabwe Timeline:
This timeline shows a graph from 1976 to 2016 of Brunei Darussalam. No data until 1975. Number of actual observations by date: 41.
Source name:
World Development Indicators
Source organization:
World Bank national accounts data, and OECD National Accounts data files.
Categories, topics:
Economy & Growth
Last updated:
apr 23, 2017
Indicators value changes by year
Minimum:
-19.827
jan 1, 1982
Maximum:
22.562
jan 1, 1980
At the date of observation
Value
Absolute change
Change from previous value
jan 1, 1976
0.355
+0.355
0.0%
jan 1, 1977
20.155
+19.8
5.57K%
jan 1, 1978
10.917
-9.239
-45.84%
jan 1, 1979
6.776
-4.141
-37.93%
jan 1, 1980
22.562
+15.787
232.98%
jan 1, 1981
-6.997
-29.559
-131.01%
jan 1, 1982
-19.827
-12.83
183.37%
jan 1, 1983
3.957
+23.783
-119.96%
jan 1, 1984
0.501
-3.455
-87.33%
jan 1, 1985
0.6
+0.098
19.62%
jan 1, 1986
-1.491
-2.091
-348.51%
jan 1, 1987
-2.715
-1.225
82.15%
jan 1, 1988
2.009
+4.725
-173.99%
jan 1, 1989
1.097
-0.912
-45.38%
jan 1, 1990
-1.074
-2.172
-197.89%
jan 1, 1991
1.089
+2.164
-201.42%
jan 1, 1992
3.146
+2.057
188.77%
jan 1, 1993
4.759
+1.613
51.26%
jan 1, 1994
0.305
-4.454
-93.6%
jan 1, 1995
3.145
+2.841
932.72%
jan 1, 1996
4.479
+1.333
42.39%
jan 1, 1997
2.878
-1.6
-35.73%
jan 1, 1998
-1.471
-4.349
-151.11%
jan 1, 1999
-0.559
+0.913
-62.04%
jan 1, 2000
3.052
+3.611
-646.48%
jan 1, 2001
2.849
-0.203
-6.64%
jan 1, 2002
2.744
-0.105
-3.7%
jan 1, 2003
3.872
+1.128
41.11%
jan 1, 2004
2.904
-0.968
-25.0%
jan 1, 2005
0.504
-2.4
-82.63%
jan 1, 2006
0.388
-0.117
-23.16%
jan 1, 2007
4.398
+4.01
1.03K%
jan 1, 2008
0.155
-4.243
-96.48%
jan 1, 2009
-1.94
-2.094
-1.35K%
jan 1, 2010
-1.765
+0.175
-9.03%
jan 1, 2011
2.599
+4.364
-247.29%
jan 1, 2012
3.745
+1.146
44.11%
jan 1, 2013
0.913
-2.832
-75.63%
jan 1, 2014
-2.126
-3.039
-332.9%
jan 1, 2015
-2.35
-0.224
10.52%
jan 1, 2016
-0.567
+1.783
-75.88%
Ranking of countries by current statistics by years


Comments: