29
/
en
AIzaSyAYiBZKx7MnpbEhh9jyipgxe19OcubqV5w
April 1, 2024
154596
India
IND
true
2
1
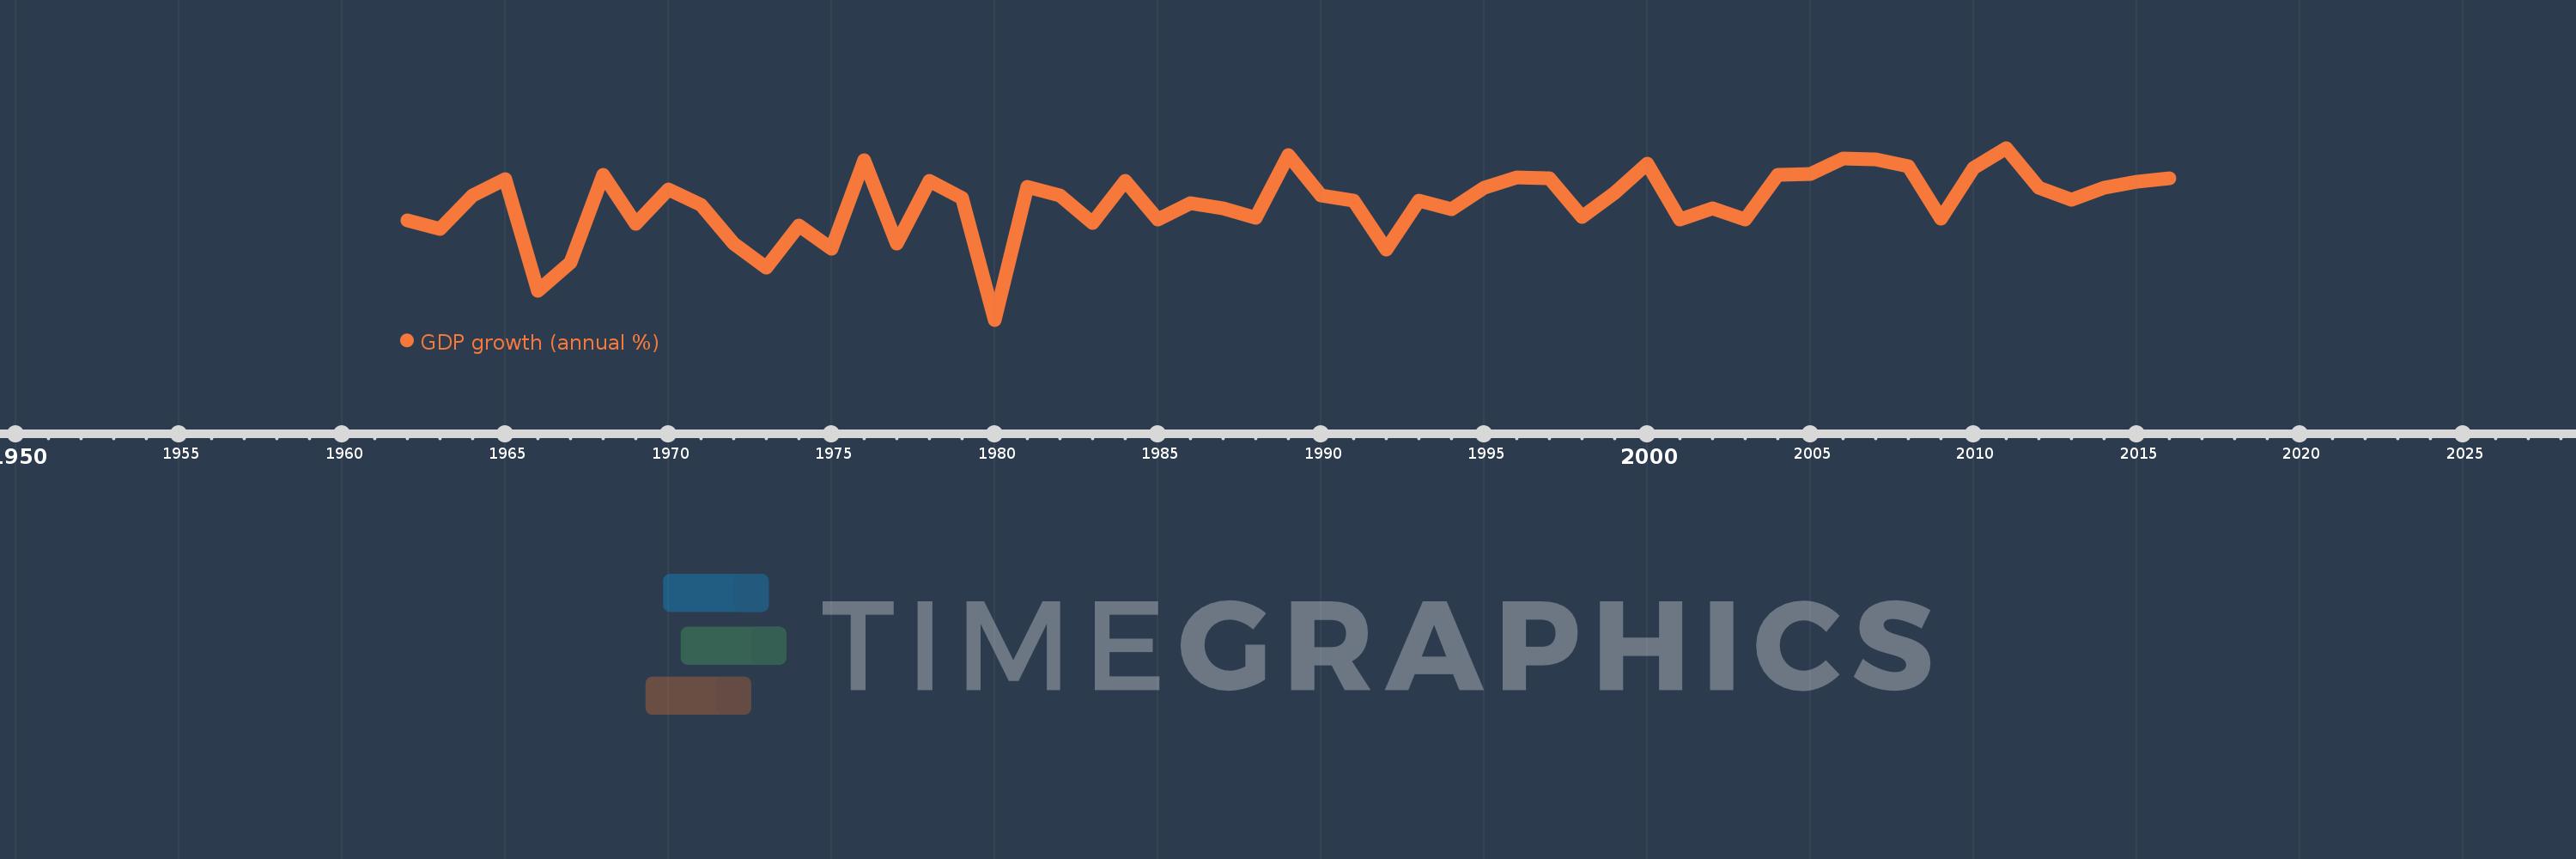
GDP growth (annual %)
2016,2015,2014,2013,2012,2011,2010,2009,2008,2007,2006,2005,2004,2003,2002,2001,2000,1999,1998,1997,1996,1995,1994,1993,1992,1991,1990,1989,1988,1987,1986,1985,1984,1983,1982,1981,1980,1979,1978,1977,1976,1975,1974,1973,1972,1971,1970,1969,1968,1967,1966,1965,1964,1963,1962
This statistics in other country:
AfghanistanAlbaniaAlgeriaAndorraAngolaAntigua and BarbudaArab WorldArgentinaArmeniaArubaAustraliaAustriaAzerbaijanBahamas, TheBahrainBangladeshBarbadosBelarusBelgiumBelizeBeninBermudaBhutanBoliviaBosnia and HerzegovinaBotswanaBrazilBrunei DarussalamBulgariaBurkina FasoBurundiCabo VerdeCambodiaCameroonCanadaCaribbean small statesCayman IslandsCentral African RepublicCentral Europe and the BalticsChadChannel IslandsChileChinaColombiaComorosCongo, Dem. Rep.Congo, Rep.Costa RicaCote d'IvoireCroatiaCubaCyprusCzech RepublicDenmarkDjiboutiDominicaDominican RepublicEarly-demographic dividendEast Asia & PacificEast Asia & Pacific (excluding high income)East Asia & Pacific (IDA & IBRD countries)EcuadorEgypt, Arab Rep.El SalvadorEquatorial GuineaEritreaEstoniaEthiopiaEuro areaEurope & Central AsiaEurope & Central Asia (excluding high income)Europe & Central Asia (IDA & IBRD countries)European UnionFijiFinlandFragile and conflict affected situationsFranceFrench PolynesiaGabonGambia, TheGeorgiaGermanyGhanaGreeceGreenlandGrenadaGuatemalaGuineaGuinea-BissauGuyanaHaitiHeavily indebted poor countries (HIPC)High incomeHondurasHong Kong SAR, ChinaHungaryIBRD onlyIcelandIDA & IBRD totalIDA blendIDA onlyIDA totalIndiaIndonesiaIran, Islamic Rep.IraqIrelandIsle of ManIsraelItalyJamaicaJapanJordanKazakhstanKenyaKiribatiKorea, Rep.KosovoKuwaitKyrgyz RepublicLao PDRLate-demographic dividendLatin America & Caribbean Latin America & Caribbean (excluding high income)Latin America & the Caribbean (IDA & IBRD countries)LatviaLeast developed countries: UN classificationLebanonLesothoLiberiaLibyaLiechtensteinLithuaniaLow & middle incomeLow incomeLower middle incomeLuxembourgMacao SAR, ChinaMacedonia, FYRMadagascarMalawiMalaysiaMaldivesMaliMaltaMarshall IslandsMauritaniaMauritiusMexicoMicronesia, Fed. Sts.Middle East & North AfricaMiddle East & North Africa (excluding high income)Middle East & North Africa (IDA & IBRD countries)Middle incomeMoldovaMonacoMongoliaMontenegroMoroccoMozambiqueMyanmarNamibiaNauruNepalNetherlandsNew CaledoniaNew ZealandNicaraguaNigerNigeriaNorth AmericaNorwayOECD membersOmanOther small statesPacific island small statesPakistanPalauPanamaPapua New GuineaParaguayPeruPhilippinesPolandPortugalPost-demographic dividendPre-demographic dividendPuerto RicoQatarRomaniaRussian FederationRwandaSamoaSan MarinoSao Tome and PrincipeSaudi ArabiaSenegalSerbiaSeychellesSierra LeoneSingaporeSlovak RepublicSloveniaSmall statesSolomon IslandsSomaliaSouth AfricaSouth AsiaSouth Asia (IDA & IBRD)South SudanSpainSri LankaSt. Kitts and NevisSt. LuciaSt. Vincent and the GrenadinesSub-Saharan Africa Sub-Saharan Africa (excluding high income)Sub-Saharan Africa (IDA & IBRD countries)SudanSurinameSwazilandSwedenSwitzerlandSyrian Arab RepublicTajikistanTanzaniaThailandTimor-LesteTogoTongaTrinidad and TobagoTunisiaTurkeyTurkmenistanTuvaluUgandaUkraineUnited Arab EmiratesUnited KingdomUnited StatesUpper middle incomeUruguayUzbekistanVanuatuVenezuela, RBVietnamVirgin Islands (U.S.)West Bank and GazaWorldYemen, Rep.ZambiaZimbabwe Timeline:
This timeline shows a graph from 1962 to 2016 of India. No data until 1961. Number of actual observations by date: 55.
Source name:
World Development Indicators
Source organization:
World Bank national accounts data, and OECD National Accounts data files.
Categories, topics:
Economy & Growth
Last updated:
apr 23, 2017
Indicators value changes by year
Minimum:
-5.238
jan 1, 1980
At the date of observation
Value
Absolute change
Change from previous value
jan 1, 1962
3.723
+3.723
0.0%
jan 1, 1963
2.931
-0.792
-21.26%
jan 1, 1964
5.994
+3.063
104.51%
jan 1, 1965
7.453
+1.459
24.33%
jan 1, 1966
-2.636
-10.089
-135.37%
jan 1, 1967
-0.055
+2.58
-97.9%
jan 1, 1968
7.826
+7.881
-14.24K%
jan 1, 1969
3.388
-4.438
-56.71%
jan 1, 1970
6.54
+3.152
93.03%
jan 1, 1971
5.157
-1.382
-21.14%
jan 1, 1972
1.643
-3.514
-68.14%
jan 1, 1973
-0.553
-2.196
-133.68%
jan 1, 1974
3.296
+3.849
-695.61%
jan 1, 1975
1.185
-2.11
-64.03%
jan 1, 1976
9.15
+7.965
671.93%
jan 1, 1977
1.663
-7.487
-81.82%
jan 1, 1978
7.255
+5.592
336.22%
jan 1, 1979
5.713
-1.542
-21.26%
jan 1, 1980
-5.238
-10.951
-191.7%
jan 1, 1981
6.736
+11.974
-228.59%
jan 1, 1982
6.006
-0.73
-10.83%
jan 1, 1983
3.476
-2.53
-42.13%
jan 1, 1984
7.289
+3.813
109.71%
jan 1, 1985
3.821
-3.468
-47.58%
jan 1, 1986
5.254
+1.434
37.52%
jan 1, 1987
4.777
-0.478
-9.09%
jan 1, 1988
3.965
-0.811
-16.98%
jan 1, 1989
9.628
+5.662
142.8%
jan 1, 1990
5.947
-3.68
-38.23%
jan 1, 1991
5.533
-0.414
-6.96%
jan 1, 1992
1.057
-4.477
-80.9%
jan 1, 1993
5.482
+4.426
418.76%
jan 1, 1994
4.751
-0.732
-13.34%
jan 1, 1995
6.659
+1.908
40.16%
jan 1, 1996
7.574
+0.916
13.75%
jan 1, 1997
7.55
-0.025
-0.33%
jan 1, 1998
4.05
-3.5
-46.36%
jan 1, 1999
6.184
+2.135
52.71%
jan 1, 2000
8.846
+2.661
43.03%
jan 1, 2001
3.841
-5.005
-56.58%
jan 1, 2002
4.824
+0.983
25.59%
jan 1, 2003
3.804
-1.02
-21.14%
jan 1, 2004
7.86
+4.056
106.64%
jan 1, 2005
7.923
+0.063
0.8%
jan 1, 2006
9.285
+1.362
17.19%
jan 1, 2007
9.264
-0.021
-0.22%
jan 1, 2008
8.608
-0.656
-7.08%
jan 1, 2009
3.891
-4.717
-54.8%
jan 1, 2010
8.48
+4.589
117.94%
jan 1, 2011
10.26
+1.78
20.99%
jan 1, 2012
6.638
-3.622
-35.3%
jan 1, 2013
5.619
-1.02
-15.36%
jan 1, 2014
6.639
+1.02
18.16%
jan 1, 2015
7.243
+0.605
9.11%
jan 1, 2016
7.563
+0.32
4.42%
Ranking of countries by current statistics by years


Comments: