29
/
en
AIzaSyAYiBZKx7MnpbEhh9jyipgxe19OcubqV5w
April 1, 2024
186510
Malawi
MWI
true
2
1
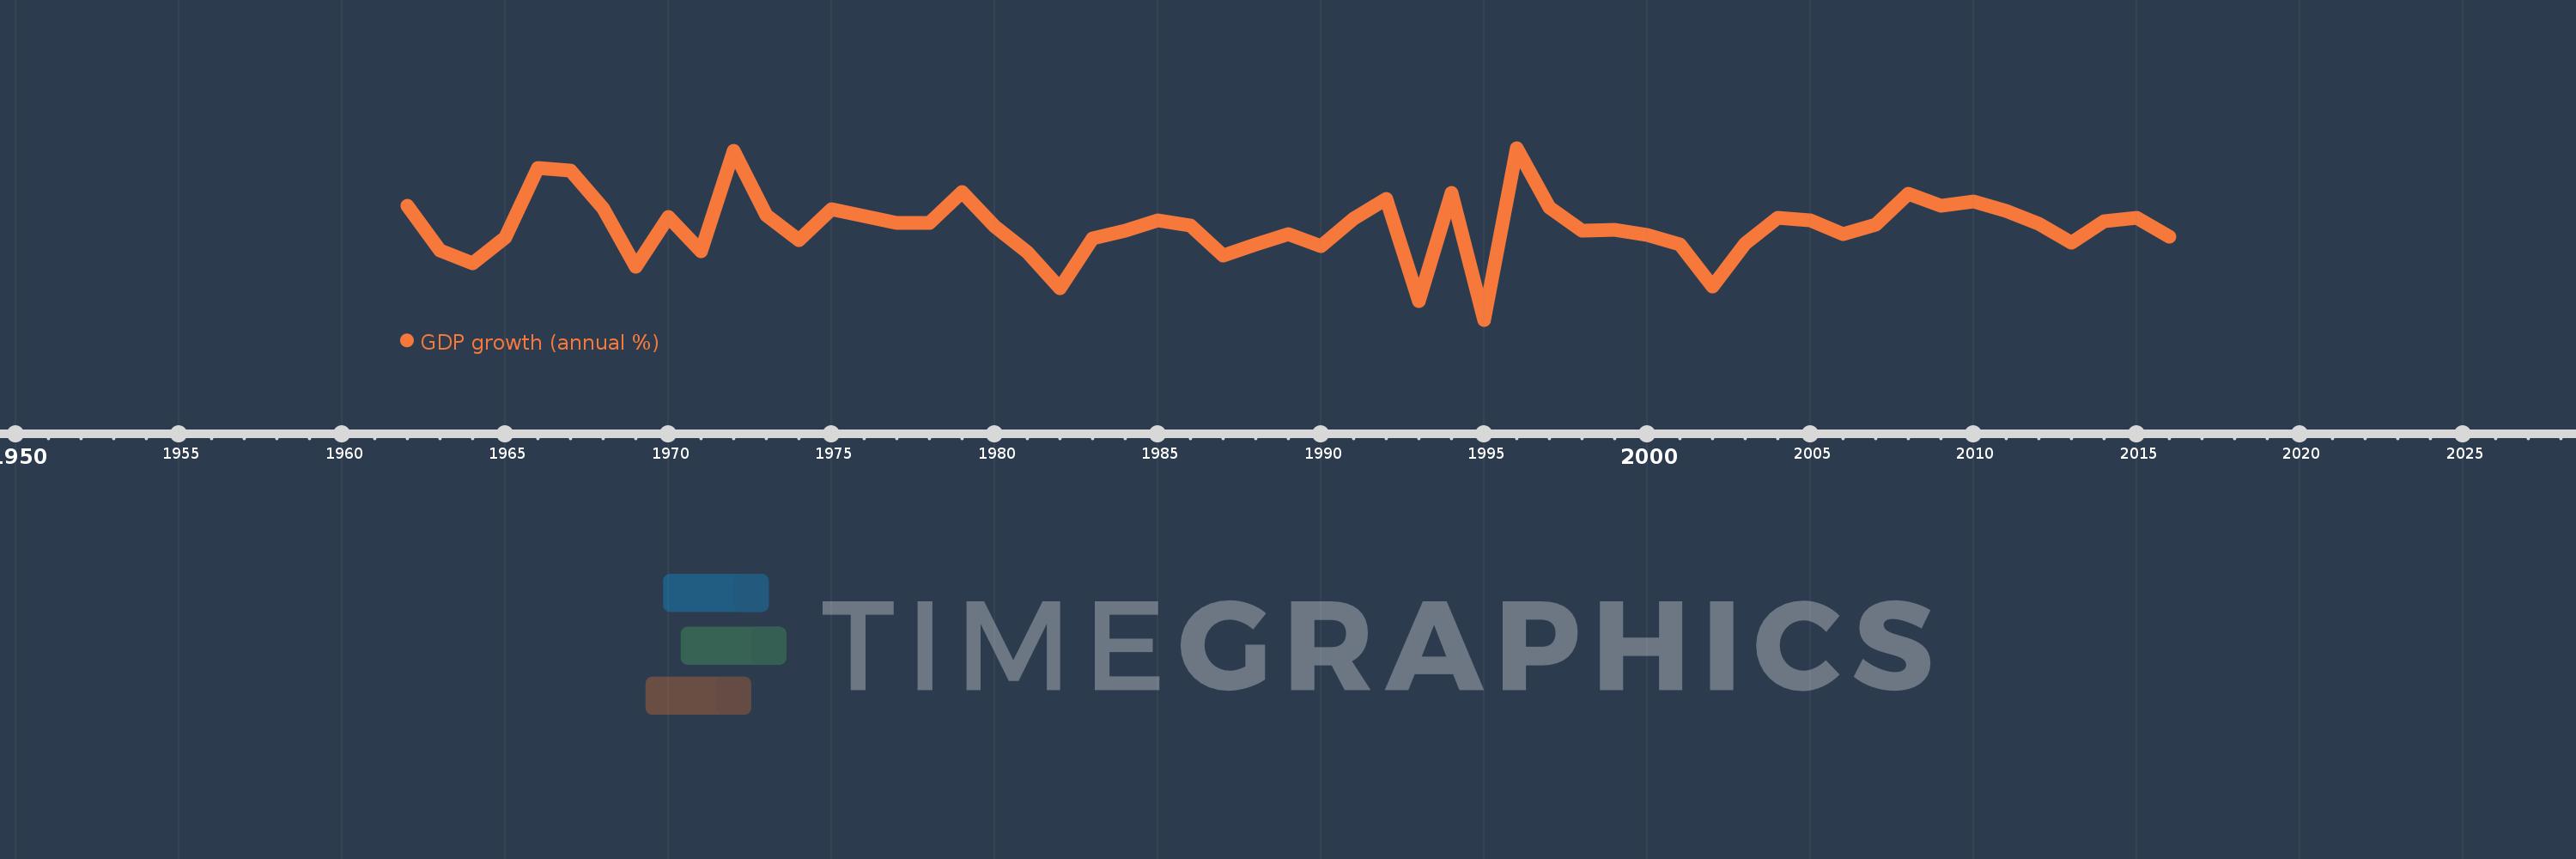
GDP growth (annual %)
2016,2015,2014,2013,2012,2011,2010,2009,2008,2007,2006,2005,2004,2003,2002,2001,2000,1999,1998,1997,1996,1995,1994,1993,1992,1991,1990,1989,1988,1987,1986,1985,1984,1983,1982,1981,1980,1979,1978,1977,1976,1975,1974,1973,1972,1971,1970,1969,1968,1967,1966,1965,1964,1963,1962
This statistics in other country:
AfghanistanAlbaniaAlgeriaAndorraAngolaAntigua and BarbudaArab WorldArgentinaArmeniaArubaAustraliaAustriaAzerbaijanBahamas, TheBahrainBangladeshBarbadosBelarusBelgiumBelizeBeninBermudaBhutanBoliviaBosnia and HerzegovinaBotswanaBrazilBrunei DarussalamBulgariaBurkina FasoBurundiCabo VerdeCambodiaCameroonCanadaCaribbean small statesCayman IslandsCentral African RepublicCentral Europe and the BalticsChadChannel IslandsChileChinaColombiaComorosCongo, Dem. Rep.Congo, Rep.Costa RicaCote d'IvoireCroatiaCubaCyprusCzech RepublicDenmarkDjiboutiDominicaDominican RepublicEarly-demographic dividendEast Asia & PacificEast Asia & Pacific (excluding high income)East Asia & Pacific (IDA & IBRD countries)EcuadorEgypt, Arab Rep.El SalvadorEquatorial GuineaEritreaEstoniaEthiopiaEuro areaEurope & Central AsiaEurope & Central Asia (excluding high income)Europe & Central Asia (IDA & IBRD countries)European UnionFijiFinlandFragile and conflict affected situationsFranceFrench PolynesiaGabonGambia, TheGeorgiaGermanyGhanaGreeceGreenlandGrenadaGuatemalaGuineaGuinea-BissauGuyanaHaitiHeavily indebted poor countries (HIPC)High incomeHondurasHong Kong SAR, ChinaHungaryIBRD onlyIcelandIDA & IBRD totalIDA blendIDA onlyIDA totalIndiaIndonesiaIran, Islamic Rep.IraqIrelandIsle of ManIsraelItalyJamaicaJapanJordanKazakhstanKenyaKiribatiKorea, Rep.KosovoKuwaitKyrgyz RepublicLao PDRLate-demographic dividendLatin America & Caribbean Latin America & Caribbean (excluding high income)Latin America & the Caribbean (IDA & IBRD countries)LatviaLeast developed countries: UN classificationLebanonLesothoLiberiaLibyaLiechtensteinLithuaniaLow & middle incomeLow incomeLower middle incomeLuxembourgMacao SAR, ChinaMacedonia, FYRMadagascarMalawiMalaysiaMaldivesMaliMaltaMarshall IslandsMauritaniaMauritiusMexicoMicronesia, Fed. Sts.Middle East & North AfricaMiddle East & North Africa (excluding high income)Middle East & North Africa (IDA & IBRD countries)Middle incomeMoldovaMonacoMongoliaMontenegroMoroccoMozambiqueMyanmarNamibiaNauruNepalNetherlandsNew CaledoniaNew ZealandNicaraguaNigerNigeriaNorth AmericaNorwayOECD membersOmanOther small statesPacific island small statesPakistanPalauPanamaPapua New GuineaParaguayPeruPhilippinesPolandPortugalPost-demographic dividendPre-demographic dividendPuerto RicoQatarRomaniaRussian FederationRwandaSamoaSan MarinoSao Tome and PrincipeSaudi ArabiaSenegalSerbiaSeychellesSierra LeoneSingaporeSlovak RepublicSloveniaSmall statesSolomon IslandsSomaliaSouth AfricaSouth AsiaSouth Asia (IDA & IBRD)South SudanSpainSri LankaSt. Kitts and NevisSt. LuciaSt. Vincent and the GrenadinesSub-Saharan Africa Sub-Saharan Africa (excluding high income)Sub-Saharan Africa (IDA & IBRD countries)SudanSurinameSwazilandSwedenSwitzerlandSyrian Arab RepublicTajikistanTanzaniaThailandTimor-LesteTogoTongaTrinidad and TobagoTunisiaTurkeyTurkmenistanTuvaluUgandaUkraineUnited Arab EmiratesUnited KingdomUnited StatesUpper middle incomeUruguayUzbekistanVanuatuVenezuela, RBVietnamVirgin Islands (U.S.)West Bank and GazaWorldYemen, Rep.ZambiaZimbabwe Timeline:
This timeline shows a graph from 1962 to 2016 of Malawi. No data until 1961. Number of actual observations by date: 55.
Source name:
World Development Indicators
Source organization:
World Bank national accounts data, and OECD National Accounts data files.
Categories, topics:
Economy & Growth
Last updated:
apr 23, 2017
Indicators value changes by year
Minimum:
-10.24
jan 1, 1995
Maximum:
16.729
jan 1, 1996
At the date of observation
Value
Absolute change
Change from previous value
jan 1, 1962
7.64
+7.64
0.0%
jan 1, 1963
0.668
-6.971
-91.25%
jan 1, 1964
-1.391
-2.059
-308.13%
jan 1, 1965
2.661
+4.052
-291.3%
jan 1, 1966
13.616
+10.955
411.69%
jan 1, 1967
13.249
-0.367
-2.7%
jan 1, 1968
7.282
-5.967
-45.04%
jan 1, 1969
-1.923
-9.205
-126.41%
jan 1, 1970
5.882
+7.805
-405.88%
jan 1, 1971
0.479
-5.403
-91.85%
jan 1, 1972
16.219
+15.739
3.28K%
jan 1, 1973
6.231
-9.987
-61.58%
jan 1, 1974
2.301
-3.931
-63.08%
jan 1, 1975
7.176
+4.875
211.91%
jan 1, 1976
6.087
-1.089
-15.18%
jan 1, 1977
4.998
-1.089
-17.89%
jan 1, 1978
4.918
-0.08
-1.59%
jan 1, 1979
9.745
+4.827
98.15%
jan 1, 1980
4.396
-5.349
-54.89%
jan 1, 1981
0.407
-3.989
-90.75%
jan 1, 1982
-5.29
-5.697
-1.4K%
jan 1, 1983
2.503
+7.794
-147.32%
jan 1, 1984
3.719
+1.215
48.54%
jan 1, 1985
5.36
+1.642
44.14%
jan 1, 1986
4.571
-0.789
-14.73%
jan 1, 1987
-0.215
-4.786
-104.7%
jan 1, 1988
1.625
+1.84
-856.62%
jan 1, 1989
3.177
+1.552
95.5%
jan 1, 1990
1.345
-1.833
-57.68%
jan 1, 1991
5.692
+4.348
323.32%
jan 1, 1992
8.73
+3.038
53.37%
jan 1, 1993
-7.333
-16.063
-184.0%
jan 1, 1994
9.692
+17.025
-232.17%
jan 1, 1995
-10.24
-19.932
-205.66%
jan 1, 1996
16.729
+26.969
-263.36%
jan 1, 1997
7.317
-9.412
-56.26%
jan 1, 1998
3.792
-3.524
-48.17%
jan 1, 1999
3.895
+0.103
2.71%
jan 1, 2000
3.042
-0.853
-21.9%
jan 1, 2001
1.576
-1.466
-48.19%
jan 1, 2002
-4.975
-6.551
-415.65%
jan 1, 2003
1.7
+6.675
-134.17%
jan 1, 2004
5.706
+4.006
235.63%
jan 1, 2005
5.42
-0.285
-5.0%
jan 1, 2006
3.269
-2.152
-39.7%
jan 1, 2007
4.7
+1.431
43.79%
jan 1, 2008
9.6
+4.9
104.26%
jan 1, 2009
7.64
-1.96
-20.42%
jan 1, 2010
8.328
+0.688
9.01%
jan 1, 2011
6.874
-1.454
-17.46%
jan 1, 2012
4.854
-2.02
-29.39%
jan 1, 2013
1.886
-2.968
-61.15%
jan 1, 2014
5.2
+3.314
175.75%
jan 1, 2015
5.7
+0.5
9.62%
jan 1, 2016
2.826
-2.874
-50.42%
Ranking of countries by current statistics by years


Comments: