29
/
en
AIzaSyAYiBZKx7MnpbEhh9jyipgxe19OcubqV5w
April 1, 2024
99918
Cameroon
CMR
true
2
1
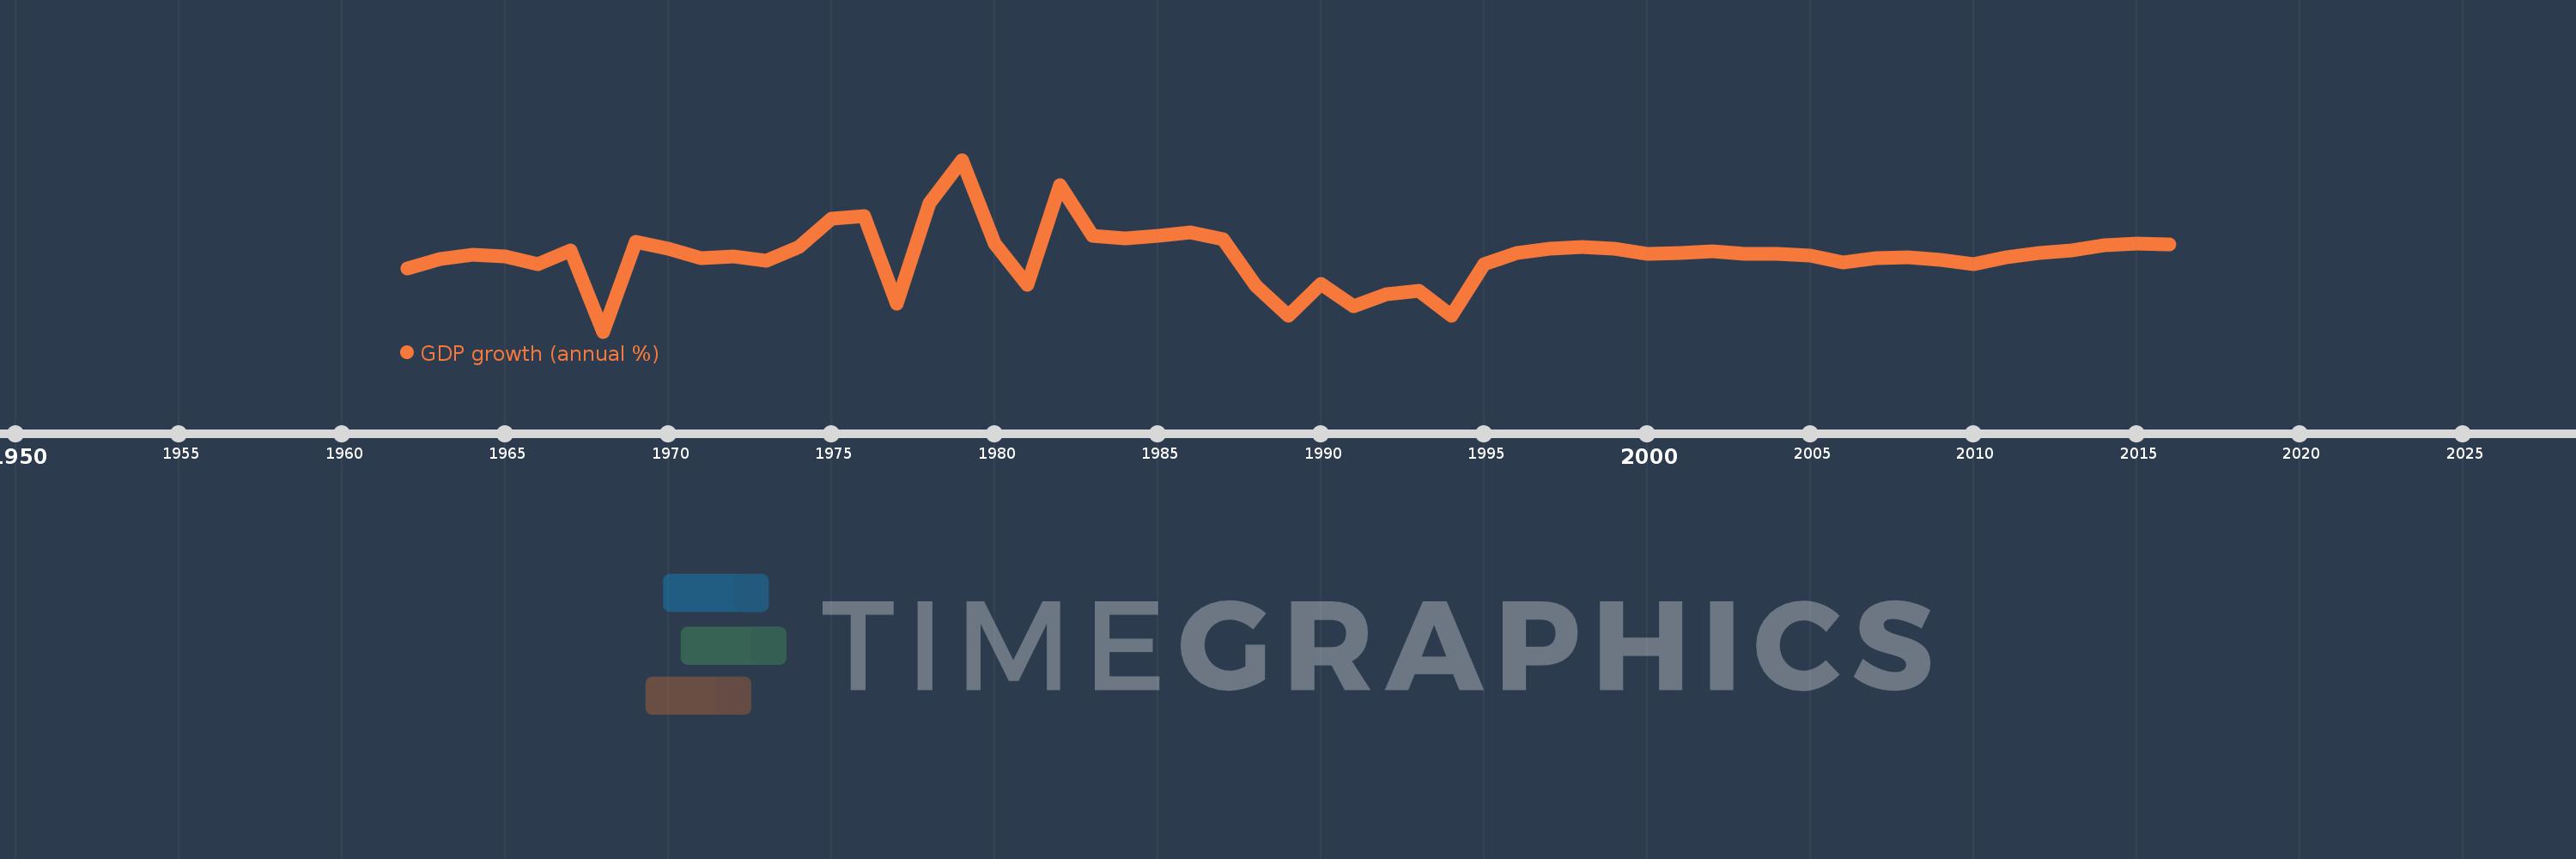
GDP growth (annual %)
2016,2015,2014,2013,2012,2011,2010,2009,2008,2007,2006,2005,2004,2003,2002,2001,2000,1999,1998,1997,1996,1995,1994,1993,1992,1991,1990,1989,1988,1987,1986,1985,1984,1983,1982,1981,1980,1979,1978,1977,1976,1975,1974,1973,1972,1971,1970,1969,1968,1967,1966,1965,1964,1963,1962
This statistics in other country:
AfghanistanAlbaniaAlgeriaAndorraAngolaAntigua and BarbudaArab WorldArgentinaArmeniaArubaAustraliaAustriaAzerbaijanBahamas, TheBahrainBangladeshBarbadosBelarusBelgiumBelizeBeninBermudaBhutanBoliviaBosnia and HerzegovinaBotswanaBrazilBrunei DarussalamBulgariaBurkina FasoBurundiCabo VerdeCambodiaCameroonCanadaCaribbean small statesCayman IslandsCentral African RepublicCentral Europe and the BalticsChadChannel IslandsChileChinaColombiaComorosCongo, Dem. Rep.Congo, Rep.Costa RicaCote d'IvoireCroatiaCubaCyprusCzech RepublicDenmarkDjiboutiDominicaDominican RepublicEarly-demographic dividendEast Asia & PacificEast Asia & Pacific (excluding high income)East Asia & Pacific (IDA & IBRD countries)EcuadorEgypt, Arab Rep.El SalvadorEquatorial GuineaEritreaEstoniaEthiopiaEuro areaEurope & Central AsiaEurope & Central Asia (excluding high income)Europe & Central Asia (IDA & IBRD countries)European UnionFijiFinlandFragile and conflict affected situationsFranceFrench PolynesiaGabonGambia, TheGeorgiaGermanyGhanaGreeceGreenlandGrenadaGuatemalaGuineaGuinea-BissauGuyanaHaitiHeavily indebted poor countries (HIPC)High incomeHondurasHong Kong SAR, ChinaHungaryIBRD onlyIcelandIDA & IBRD totalIDA blendIDA onlyIDA totalIndiaIndonesiaIran, Islamic Rep.IraqIrelandIsle of ManIsraelItalyJamaicaJapanJordanKazakhstanKenyaKiribatiKorea, Rep.KosovoKuwaitKyrgyz RepublicLao PDRLate-demographic dividendLatin America & Caribbean Latin America & Caribbean (excluding high income)Latin America & the Caribbean (IDA & IBRD countries)LatviaLeast developed countries: UN classificationLebanonLesothoLiberiaLibyaLiechtensteinLithuaniaLow & middle incomeLow incomeLower middle incomeLuxembourgMacao SAR, ChinaMacedonia, FYRMadagascarMalawiMalaysiaMaldivesMaliMaltaMarshall IslandsMauritaniaMauritiusMexicoMicronesia, Fed. Sts.Middle East & North AfricaMiddle East & North Africa (excluding high income)Middle East & North Africa (IDA & IBRD countries)Middle incomeMoldovaMonacoMongoliaMontenegroMoroccoMozambiqueMyanmarNamibiaNauruNepalNetherlandsNew CaledoniaNew ZealandNicaraguaNigerNigeriaNorth AmericaNorwayOECD membersOmanOther small statesPacific island small statesPakistanPalauPanamaPapua New GuineaParaguayPeruPhilippinesPolandPortugalPost-demographic dividendPre-demographic dividendPuerto RicoQatarRomaniaRussian FederationRwandaSamoaSan MarinoSao Tome and PrincipeSaudi ArabiaSenegalSerbiaSeychellesSierra LeoneSingaporeSlovak RepublicSloveniaSmall statesSolomon IslandsSomaliaSouth AfricaSouth AsiaSouth Asia (IDA & IBRD)South SudanSpainSri LankaSt. Kitts and NevisSt. LuciaSt. Vincent and the GrenadinesSub-Saharan Africa Sub-Saharan Africa (excluding high income)Sub-Saharan Africa (IDA & IBRD countries)SudanSurinameSwazilandSwedenSwitzerlandSyrian Arab RepublicTajikistanTanzaniaThailandTimor-LesteTogoTongaTrinidad and TobagoTunisiaTurkeyTurkmenistanTuvaluUgandaUkraineUnited Arab EmiratesUnited KingdomUnited StatesUpper middle incomeUruguayUzbekistanVanuatuVenezuela, RBVietnamVirgin Islands (U.S.)West Bank and GazaWorldYemen, Rep.ZambiaZimbabwe Timeline:
This timeline shows a graph from 1962 to 2016 of Cameroon. No data until 1961. Number of actual observations by date: 55.
Source name:
World Development Indicators
Source organization:
World Bank national accounts data, and OECD National Accounts data files.
Categories, topics:
Economy & Growth
Last updated:
apr 23, 2017
Indicators value changes by year
Minimum:
-10.912
jan 1, 1968
Maximum:
22.003
jan 1, 1979
At the date of observation
Value
Absolute change
Change from previous value
jan 1, 1962
1.184
+1.184
0.0%
jan 1, 1963
3.042
+1.858
156.96%
jan 1, 1964
3.743
+0.701
23.05%
jan 1, 1965
3.547
-0.195
-5.22%
jan 1, 1966
2.026
-1.521
-42.88%
jan 1, 1967
4.615
+2.589
127.78%
jan 1, 1968
-10.912
-15.527
-336.45%
jan 1, 1969
6.346
+17.258
-158.16%
jan 1, 1970
4.901
-1.445
-22.77%
jan 1, 1971
3.092
-1.809
-36.92%
jan 1, 1972
3.48
+0.388
12.54%
jan 1, 1973
2.674
-0.806
-23.16%
jan 1, 1974
5.356
+2.682
100.3%
jan 1, 1975
10.734
+5.379
100.43%
jan 1, 1976
11.245
+0.511
4.76%
jan 1, 1977
-5.495
-16.74
-148.87%
jan 1, 1978
13.74
+19.235
-350.04%
jan 1, 1979
22.003
+8.263
60.14%
jan 1, 1980
6.035
-15.968
-72.57%
jan 1, 1981
-1.965
-8.0
-132.56%
jan 1, 1982
17.083
+19.048
-969.22%
jan 1, 1983
7.516
-9.566
-56.0%
jan 1, 1984
6.867
-0.649
-8.64%
jan 1, 1985
7.475
+0.608
8.85%
jan 1, 1986
8.063
+0.589
7.87%
jan 1, 1987
6.772
-1.291
-16.02%
jan 1, 1988
-2.147
-8.918
-131.7%
jan 1, 1989
-7.824
-5.677
264.46%
jan 1, 1990
-1.819
+6.005
-76.75%
jan 1, 1991
-6.106
-4.287
235.64%
jan 1, 1992
-3.809
+2.297
-37.62%
jan 1, 1993
-3.1
+0.709
-18.61%
jan 1, 1994
-7.932
-4.832
155.87%
jan 1, 1995
2.063
+9.995
-126.01%
jan 1, 1996
4.128
+2.065
100.08%
jan 1, 1997
4.912
+0.784
18.98%
jan 1, 1998
5.314
+0.402
8.19%
jan 1, 1999
4.895
-0.419
-7.88%
jan 1, 2000
4.062
-0.833
-17.02%
jan 1, 2001
4.174
+0.111
2.74%
jan 1, 2002
4.514
+0.341
8.16%
jan 1, 2003
4.009
-0.505
-11.19%
jan 1, 2004
4.031
+0.022
0.55%
jan 1, 2005
3.702
-0.329
-8.17%
jan 1, 2006
2.297
-1.405
-37.95%
jan 1, 2007
3.224
+0.927
40.37%
jan 1, 2008
3.256
+0.032
0.98%
jan 1, 2009
2.884
-0.372
-11.41%
jan 1, 2010
1.932
-0.952
-33.02%
jan 1, 2011
3.269
+1.337
69.2%
jan 1, 2012
4.141
+0.872
26.68%
jan 1, 2013
4.589
+0.448
10.82%
jan 1, 2014
5.562
+0.973
21.2%
jan 1, 2015
5.927
+0.365
6.57%
jan 1, 2016
5.773
-0.154
-2.59%
Ranking of countries by current statistics by years


Comments: