29
/
en
AIzaSyAYiBZKx7MnpbEhh9jyipgxe19OcubqV5w
April 1, 2024
42380
Latin America & Caribbean (excluding high income)
LAC
false
2
1
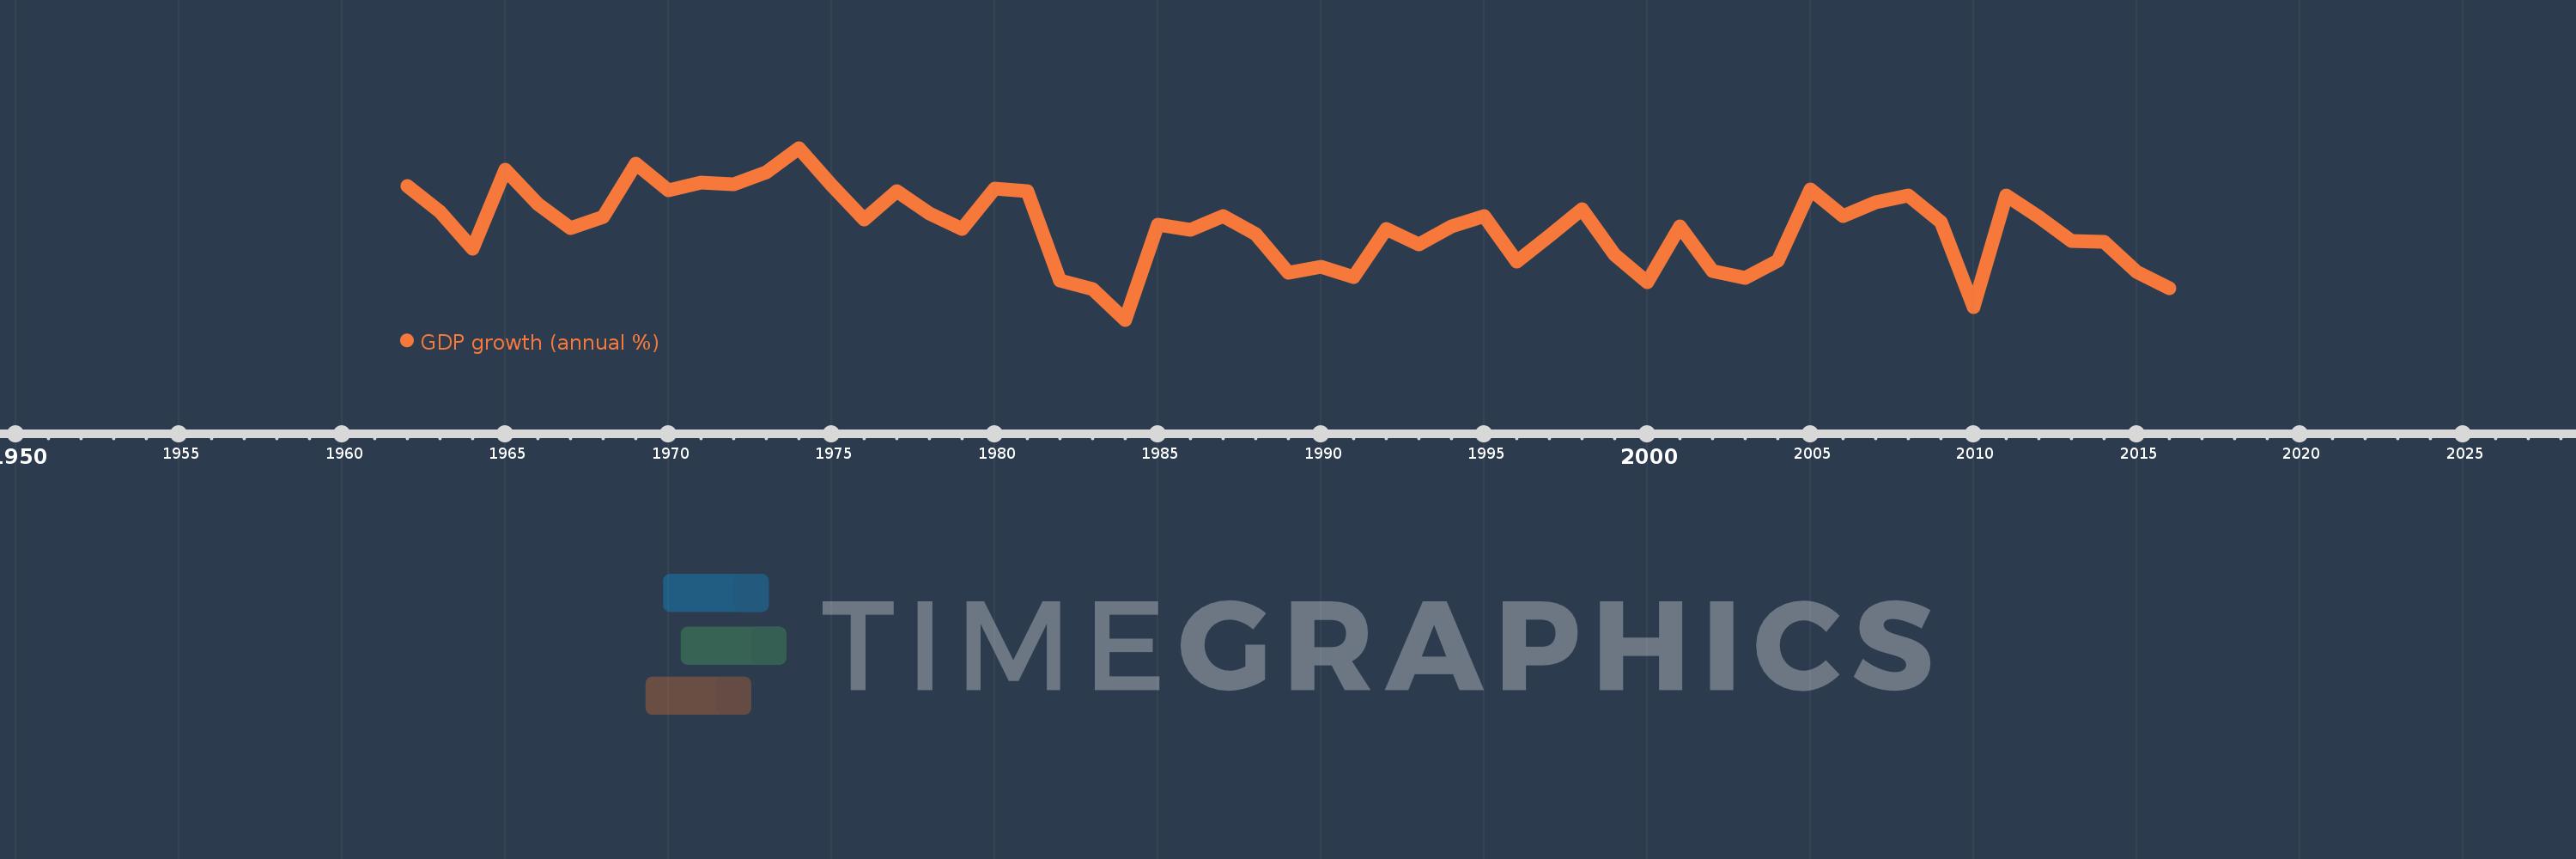
GDP growth (annual %)
2016,2015,2014,2013,2012,2011,2010,2009,2008,2007,2006,2005,2004,2003,2002,2001,2000,1999,1998,1997,1996,1995,1994,1993,1992,1991,1990,1989,1988,1987,1986,1985,1984,1983,1982,1981,1980,1979,1978,1977,1976,1975,1974,1973,1972,1971,1970,1969,1968,1967,1966,1965,1964,1963,1962
This statistics in other country:
AfghanistanAlbaniaAlgeriaAndorraAngolaAntigua and BarbudaArab WorldArgentinaArmeniaArubaAustraliaAustriaAzerbaijanBahamas, TheBahrainBangladeshBarbadosBelarusBelgiumBelizeBeninBermudaBhutanBoliviaBosnia and HerzegovinaBotswanaBrazilBrunei DarussalamBulgariaBurkina FasoBurundiCabo VerdeCambodiaCameroonCanadaCaribbean small statesCayman IslandsCentral African RepublicCentral Europe and the BalticsChadChannel IslandsChileChinaColombiaComorosCongo, Dem. Rep.Congo, Rep.Costa RicaCote d'IvoireCroatiaCubaCyprusCzech RepublicDenmarkDjiboutiDominicaDominican RepublicEarly-demographic dividendEast Asia & PacificEast Asia & Pacific (excluding high income)East Asia & Pacific (IDA & IBRD countries)EcuadorEgypt, Arab Rep.El SalvadorEquatorial GuineaEritreaEstoniaEthiopiaEuro areaEurope & Central AsiaEurope & Central Asia (excluding high income)Europe & Central Asia (IDA & IBRD countries)European UnionFijiFinlandFragile and conflict affected situationsFranceFrench PolynesiaGabonGambia, TheGeorgiaGermanyGhanaGreeceGreenlandGrenadaGuatemalaGuineaGuinea-BissauGuyanaHaitiHeavily indebted poor countries (HIPC)High incomeHondurasHong Kong SAR, ChinaHungaryIBRD onlyIcelandIDA & IBRD totalIDA blendIDA onlyIDA totalIndiaIndonesiaIran, Islamic Rep.IraqIrelandIsle of ManIsraelItalyJamaicaJapanJordanKazakhstanKenyaKiribatiKorea, Rep.KosovoKuwaitKyrgyz RepublicLao PDRLate-demographic dividendLatin America & Caribbean Latin America & Caribbean (excluding high income)Latin America & the Caribbean (IDA & IBRD countries)LatviaLeast developed countries: UN classificationLebanonLesothoLiberiaLibyaLiechtensteinLithuaniaLow & middle incomeLow incomeLower middle incomeLuxembourgMacao SAR, ChinaMacedonia, FYRMadagascarMalawiMalaysiaMaldivesMaliMaltaMarshall IslandsMauritaniaMauritiusMexicoMicronesia, Fed. Sts.Middle East & North AfricaMiddle East & North Africa (excluding high income)Middle East & North Africa (IDA & IBRD countries)Middle incomeMoldovaMonacoMongoliaMontenegroMoroccoMozambiqueMyanmarNamibiaNauruNepalNetherlandsNew CaledoniaNew ZealandNicaraguaNigerNigeriaNorth AmericaNorwayOECD membersOmanOther small statesPacific island small statesPakistanPalauPanamaPapua New GuineaParaguayPeruPhilippinesPolandPortugalPost-demographic dividendPre-demographic dividendPuerto RicoQatarRomaniaRussian FederationRwandaSamoaSan MarinoSao Tome and PrincipeSaudi ArabiaSenegalSerbiaSeychellesSierra LeoneSingaporeSlovak RepublicSloveniaSmall statesSolomon IslandsSomaliaSouth AfricaSouth AsiaSouth Asia (IDA & IBRD)South SudanSpainSri LankaSt. Kitts and NevisSt. LuciaSt. Vincent and the GrenadinesSub-Saharan Africa Sub-Saharan Africa (excluding high income)Sub-Saharan Africa (IDA & IBRD countries)SudanSurinameSwazilandSwedenSwitzerlandSyrian Arab RepublicTajikistanTanzaniaThailandTimor-LesteTogoTongaTrinidad and TobagoTunisiaTurkeyTurkmenistanTuvaluUgandaUkraineUnited Arab EmiratesUnited KingdomUnited StatesUpper middle incomeUruguayUzbekistanVanuatuVenezuela, RBVietnamVirgin Islands (U.S.)West Bank and GazaWorldYemen, Rep.ZambiaZimbabwe Timeline:
This timeline shows a graph from 1962 to 2016 of Latin America & Caribbean (excluding high income). No data until 1961. Number of actual observations by date: 55.
Source name:
World Development Indicators
Source organization:
World Bank national accounts data, and OECD National Accounts data files.
Categories, topics:
Economy & Growth
Last updated:
apr 23, 2017
Indicators value changes by year
Minimum:
-2.618
jan 1, 1984
At the date of observation
Value
Absolute change
Change from previous value
jan 1, 1962
6.625
+6.625
0.0%
jan 1, 1963
4.869
-1.756
-26.51%
jan 1, 1964
2.29
-2.579
-52.96%
jan 1, 1965
7.725
+5.435
237.31%
jan 1, 1966
5.353
-2.372
-30.71%
jan 1, 1967
3.745
-1.608
-30.03%
jan 1, 1968
4.511
+0.766
20.46%
jan 1, 1969
8.142
+3.63
80.47%
jan 1, 1970
6.339
-1.802
-22.14%
jan 1, 1971
6.883
+0.544
8.58%
jan 1, 1972
6.723
-0.161
-2.33%
jan 1, 1973
7.603
+0.88
13.09%
jan 1, 1974
9.255
+1.652
21.73%
jan 1, 1975
6.676
-2.579
-27.86%
jan 1, 1976
4.299
-2.377
-35.6%
jan 1, 1977
6.241
+1.942
45.16%
jan 1, 1978
4.712
-1.529
-24.5%
jan 1, 1979
3.653
-1.059
-22.48%
jan 1, 1980
6.468
+2.816
77.09%
jan 1, 1981
6.265
-0.204
-3.15%
jan 1, 1982
0.107
-6.158
-98.29%
jan 1, 1983
-0.472
-0.579
-540.89%
jan 1, 1984
-2.618
-2.146
454.67%
jan 1, 1985
3.927
+6.545
-250.01%
jan 1, 1986
3.601
-0.326
-8.3%
jan 1, 1987
4.522
+0.921
25.57%
jan 1, 1988
3.293
-1.229
-27.17%
jan 1, 1989
0.634
-2.659
-80.74%
jan 1, 1990
1.041
+0.407
64.15%
jan 1, 1991
0.36
-0.682
-65.46%
jan 1, 1992
3.684
+3.325
924.39%
jan 1, 1993
2.568
-1.117
-30.31%
jan 1, 1994
3.85
+1.282
49.93%
jan 1, 1995
4.537
+0.687
17.86%
jan 1, 1996
1.372
-3.165
-69.76%
jan 1, 1997
3.197
+1.825
133.01%
jan 1, 1998
5.034
+1.836
57.44%
jan 1, 1999
1.9
-3.134
-62.25%
jan 1, 2000
-0.034
-1.934
-101.77%
jan 1, 2001
3.829
+3.863
-11.47K%
jan 1, 2002
0.751
-3.078
-80.38%
jan 1, 2003
0.246
-0.506
-67.32%
jan 1, 2004
1.462
+1.217
495.44%
jan 1, 2005
6.374
+4.912
335.96%
jan 1, 2006
4.525
-1.849
-29.01%
jan 1, 2007
5.501
+0.976
21.58%
jan 1, 2008
5.979
+0.477
8.68%
jan 1, 2009
4.142
-1.837
-30.72%
jan 1, 2010
-1.766
-5.908
-142.63%
jan 1, 2011
5.993
+7.758
-439.42%
jan 1, 2012
4.465
-1.528
-25.5%
jan 1, 2013
2.817
-1.648
-36.92%
jan 1, 2014
2.779
-0.037
-1.33%
jan 1, 2015
0.671
-2.108
-75.85%
jan 1, 2016
-0.44
-1.111
-165.57%
Ranking of countries by current statistics by years


Comments: