29
/
en
AIzaSyAYiBZKx7MnpbEhh9jyipgxe19OcubqV5w
April 1, 2024
215273
Oman
OMN
true
2
1
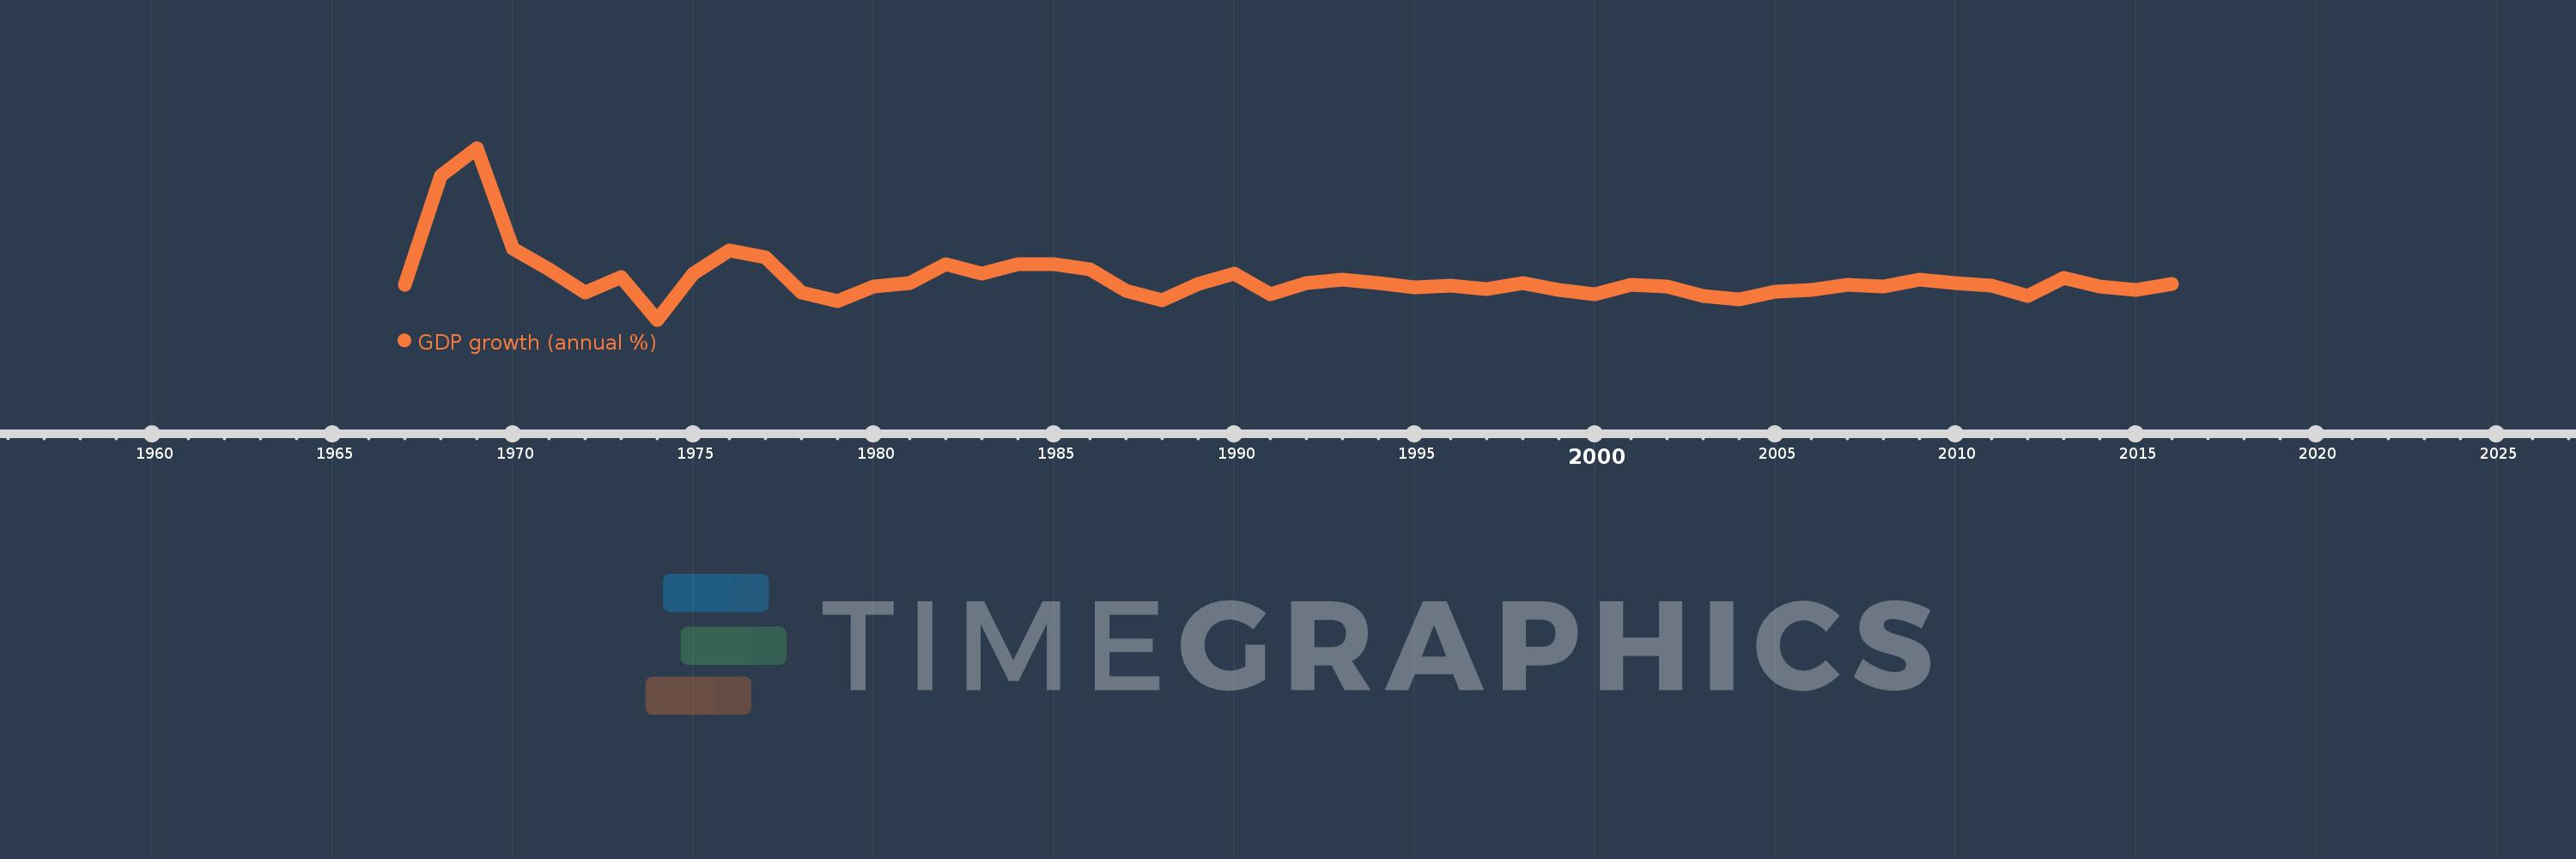
GDP growth (annual %)
2016,2015,2014,2013,2012,2011,2010,2009,2008,2007,2006,2005,2004,2003,2002,2001,2000,1999,1998,1997,1996,1995,1994,1993,1992,1991,1990,1989,1988,1987,1986,1985,1984,1983,1982,1981,1980,1979,1978,1977,1976,1975,1974,1973,1972,1971,1970,1969,1968,1967
This statistics in other country:
AfghanistanAlbaniaAlgeriaAndorraAngolaAntigua and BarbudaArab WorldArgentinaArmeniaArubaAustraliaAustriaAzerbaijanBahamas, TheBahrainBangladeshBarbadosBelarusBelgiumBelizeBeninBermudaBhutanBoliviaBosnia and HerzegovinaBotswanaBrazilBrunei DarussalamBulgariaBurkina FasoBurundiCabo VerdeCambodiaCameroonCanadaCaribbean small statesCayman IslandsCentral African RepublicCentral Europe and the BalticsChadChannel IslandsChileChinaColombiaComorosCongo, Dem. Rep.Congo, Rep.Costa RicaCote d'IvoireCroatiaCubaCyprusCzech RepublicDenmarkDjiboutiDominicaDominican RepublicEarly-demographic dividendEast Asia & PacificEast Asia & Pacific (excluding high income)East Asia & Pacific (IDA & IBRD countries)EcuadorEgypt, Arab Rep.El SalvadorEquatorial GuineaEritreaEstoniaEthiopiaEuro areaEurope & Central AsiaEurope & Central Asia (excluding high income)Europe & Central Asia (IDA & IBRD countries)European UnionFijiFinlandFragile and conflict affected situationsFranceFrench PolynesiaGabonGambia, TheGeorgiaGermanyGhanaGreeceGreenlandGrenadaGuatemalaGuineaGuinea-BissauGuyanaHaitiHeavily indebted poor countries (HIPC)High incomeHondurasHong Kong SAR, ChinaHungaryIBRD onlyIcelandIDA & IBRD totalIDA blendIDA onlyIDA totalIndiaIndonesiaIran, Islamic Rep.IraqIrelandIsle of ManIsraelItalyJamaicaJapanJordanKazakhstanKenyaKiribatiKorea, Rep.KosovoKuwaitKyrgyz RepublicLao PDRLate-demographic dividendLatin America & Caribbean Latin America & Caribbean (excluding high income)Latin America & the Caribbean (IDA & IBRD countries)LatviaLeast developed countries: UN classificationLebanonLesothoLiberiaLibyaLiechtensteinLithuaniaLow & middle incomeLow incomeLower middle incomeLuxembourgMacao SAR, ChinaMacedonia, FYRMadagascarMalawiMalaysiaMaldivesMaliMaltaMarshall IslandsMauritaniaMauritiusMexicoMicronesia, Fed. Sts.Middle East & North AfricaMiddle East & North Africa (excluding high income)Middle East & North Africa (IDA & IBRD countries)Middle incomeMoldovaMonacoMongoliaMontenegroMoroccoMozambiqueMyanmarNamibiaNauruNepalNetherlandsNew CaledoniaNew ZealandNicaraguaNigerNigeriaNorth AmericaNorwayOECD membersOmanOther small statesPacific island small statesPakistanPalauPanamaPapua New GuineaParaguayPeruPhilippinesPolandPortugalPost-demographic dividendPre-demographic dividendPuerto RicoQatarRomaniaRussian FederationRwandaSamoaSan MarinoSao Tome and PrincipeSaudi ArabiaSenegalSerbiaSeychellesSierra LeoneSingaporeSlovak RepublicSloveniaSmall statesSolomon IslandsSomaliaSouth AfricaSouth AsiaSouth Asia (IDA & IBRD)South SudanSpainSri LankaSt. Kitts and NevisSt. LuciaSt. Vincent and the GrenadinesSub-Saharan Africa Sub-Saharan Africa (excluding high income)Sub-Saharan Africa (IDA & IBRD countries)SudanSurinameSwazilandSwedenSwitzerlandSyrian Arab RepublicTajikistanTanzaniaThailandTimor-LesteTogoTongaTrinidad and TobagoTunisiaTurkeyTurkmenistanTuvaluUgandaUkraineUnited Arab EmiratesUnited KingdomUnited StatesUpper middle incomeUruguayUzbekistanVanuatuVenezuela, RBVietnamVirgin Islands (U.S.)West Bank and GazaWorldYemen, Rep.ZambiaZimbabwe Timeline:
This timeline shows a graph from 1967 to 2016 of Oman. No data until 1966. Number of actual observations by date: 50.
Source name:
World Development Indicators
Source organization:
World Bank national accounts data, and OECD National Accounts data files.
Categories, topics:
Economy & Growth
Last updated:
apr 23, 2017
Indicators value changes by year
Minimum:
-14.252
jan 1, 1974
Maximum:
81.888
jan 1, 1969
At the date of observation
Value
Absolute change
Change from previous value
jan 1, 1967
5.204
+5.204
0.0%
jan 1, 1968
66.219
+61.015
1.17K%
jan 1, 1969
81.888
+15.669
23.66%
jan 1, 1970
25.666
-56.222
-68.66%
jan 1, 1971
13.895
-11.771
-45.86%
jan 1, 1972
0.898
-12.997
-93.54%
jan 1, 1973
9.825
+8.927
993.85%
jan 1, 1974
-14.252
-24.077
-245.06%
jan 1, 1975
11.499
+25.751
-180.68%
jan 1, 1976
24.434
+12.935
112.49%
jan 1, 1977
20.54
-3.893
-15.93%
jan 1, 1978
1.007
-19.533
-95.1%
jan 1, 1979
-3.694
-4.701
-466.71%
jan 1, 1980
4.332
+8.025
-217.28%
jan 1, 1981
6.035
+1.704
39.33%
jan 1, 1982
17.047
+11.012
182.45%
jan 1, 1983
11.57
-5.477
-32.13%
jan 1, 1984
16.667
+5.097
44.05%
jan 1, 1985
16.712
+0.045
0.27%
jan 1, 1986
14.007
-2.704
-16.18%
jan 1, 1987
2.002
-12.005
-85.71%
jan 1, 1988
-3.441
-5.443
-271.85%
jan 1, 1989
5.964
+9.405
-273.33%
jan 1, 1990
11.757
+5.793
97.13%
jan 1, 1991
-0.13
-11.887
-101.11%
jan 1, 1992
6.074
+6.205
-4.76K%
jan 1, 1993
8.414
+2.34
38.52%
jan 1, 1994
6.043
-2.371
-28.18%
jan 1, 1995
3.876
-2.167
-35.86%
jan 1, 1996
4.997
+1.121
28.92%
jan 1, 1997
3.046
-1.951
-39.04%
jan 1, 1998
6.034
+2.988
98.08%
jan 1, 1999
2.642
-3.391
-56.21%
jan 1, 2000
-0.125
-2.767
-104.72%
jan 1, 2001
5.401
+5.526
-4.43K%
jan 1, 2002
4.482
-0.919
-17.01%
jan 1, 2003
-1.101
-5.583
-124.55%
jan 1, 2004
-2.669
-1.568
142.51%
jan 1, 2005
1.292
+3.961
-148.41%
jan 1, 2006
2.49
+1.198
92.74%
jan 1, 2007
5.372
+2.882
115.71%
jan 1, 2008
4.453
-0.919
-17.11%
jan 1, 2009
8.2
+3.747
84.15%
jan 1, 2010
6.112
-2.087
-25.46%
jan 1, 2011
4.803
-1.31
-21.43%
jan 1, 2012
-1.107
-5.91
-123.05%
jan 1, 2013
9.333
+10.44
-943.07%
jan 1, 2014
4.373
-4.96
-53.15%
jan 1, 2015
2.543
-1.83
-41.85%
jan 1, 2016
5.653
+3.11
122.32%
Ranking of countries by current statistics by years


Comments: