29
/
en
AIzaSyAYiBZKx7MnpbEhh9jyipgxe19OcubqV5w
April 1, 2024
102434
Central African Republic
CAF
true
2
1
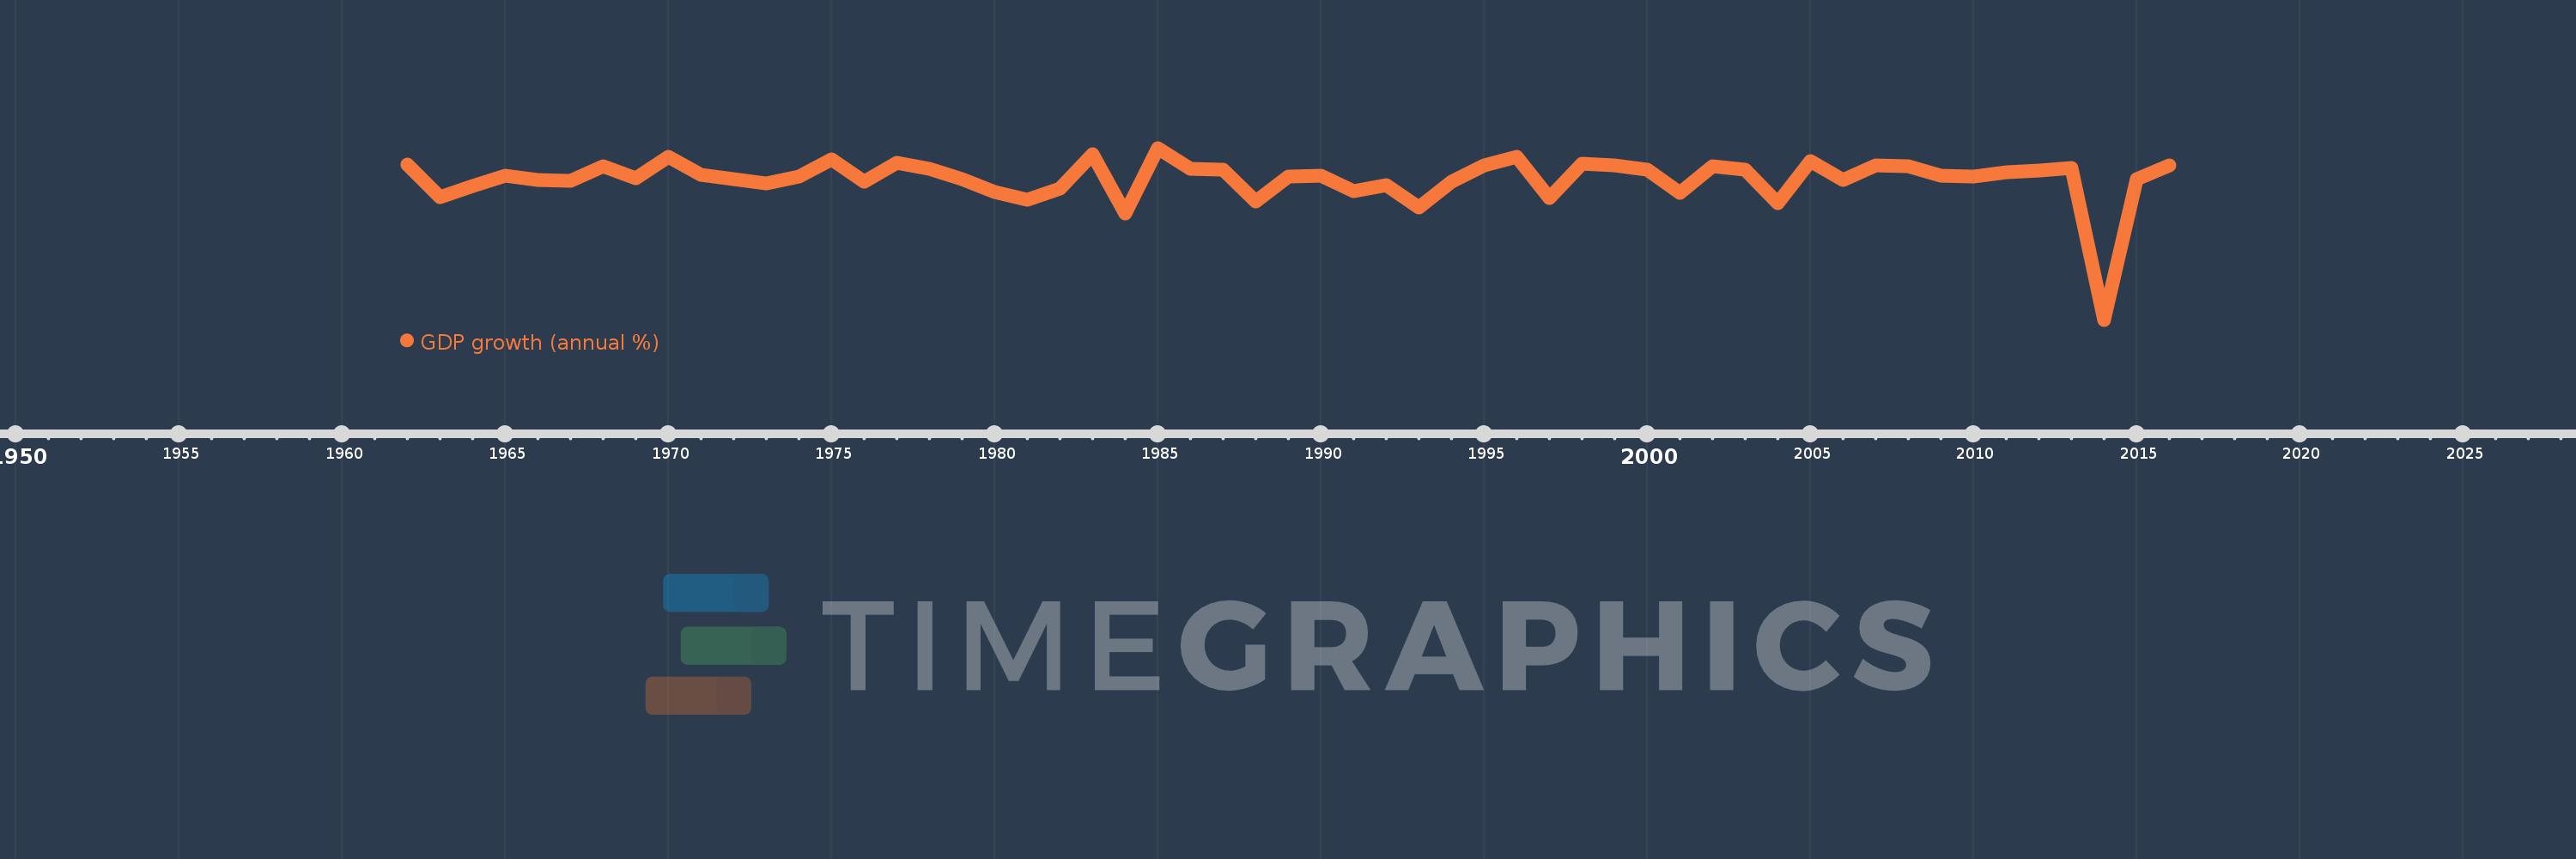
GDP growth (annual %)
2016,2015,2014,2013,2012,2011,2010,2009,2008,2007,2006,2005,2004,2003,2002,2001,2000,1999,1998,1997,1996,1995,1994,1993,1992,1991,1990,1989,1988,1987,1986,1985,1984,1983,1982,1981,1980,1979,1978,1977,1976,1975,1974,1973,1972,1971,1970,1969,1968,1967,1966,1965,1964,1963,1962
This statistics in other country:
AfghanistanAlbaniaAlgeriaAndorraAngolaAntigua and BarbudaArab WorldArgentinaArmeniaArubaAustraliaAustriaAzerbaijanBahamas, TheBahrainBangladeshBarbadosBelarusBelgiumBelizeBeninBermudaBhutanBoliviaBosnia and HerzegovinaBotswanaBrazilBrunei DarussalamBulgariaBurkina FasoBurundiCabo VerdeCambodiaCameroonCanadaCaribbean small statesCayman IslandsCentral African RepublicCentral Europe and the BalticsChadChannel IslandsChileChinaColombiaComorosCongo, Dem. Rep.Congo, Rep.Costa RicaCote d'IvoireCroatiaCubaCyprusCzech RepublicDenmarkDjiboutiDominicaDominican RepublicEarly-demographic dividendEast Asia & PacificEast Asia & Pacific (excluding high income)East Asia & Pacific (IDA & IBRD countries)EcuadorEgypt, Arab Rep.El SalvadorEquatorial GuineaEritreaEstoniaEthiopiaEuro areaEurope & Central AsiaEurope & Central Asia (excluding high income)Europe & Central Asia (IDA & IBRD countries)European UnionFijiFinlandFragile and conflict affected situationsFranceFrench PolynesiaGabonGambia, TheGeorgiaGermanyGhanaGreeceGreenlandGrenadaGuatemalaGuineaGuinea-BissauGuyanaHaitiHeavily indebted poor countries (HIPC)High incomeHondurasHong Kong SAR, ChinaHungaryIBRD onlyIcelandIDA & IBRD totalIDA blendIDA onlyIDA totalIndiaIndonesiaIran, Islamic Rep.IraqIrelandIsle of ManIsraelItalyJamaicaJapanJordanKazakhstanKenyaKiribatiKorea, Rep.KosovoKuwaitKyrgyz RepublicLao PDRLate-demographic dividendLatin America & Caribbean Latin America & Caribbean (excluding high income)Latin America & the Caribbean (IDA & IBRD countries)LatviaLeast developed countries: UN classificationLebanonLesothoLiberiaLibyaLiechtensteinLithuaniaLow & middle incomeLow incomeLower middle incomeLuxembourgMacao SAR, ChinaMacedonia, FYRMadagascarMalawiMalaysiaMaldivesMaliMaltaMarshall IslandsMauritaniaMauritiusMexicoMicronesia, Fed. Sts.Middle East & North AfricaMiddle East & North Africa (excluding high income)Middle East & North Africa (IDA & IBRD countries)Middle incomeMoldovaMonacoMongoliaMontenegroMoroccoMozambiqueMyanmarNamibiaNauruNepalNetherlandsNew CaledoniaNew ZealandNicaraguaNigerNigeriaNorth AmericaNorwayOECD membersOmanOther small statesPacific island small statesPakistanPalauPanamaPapua New GuineaParaguayPeruPhilippinesPolandPortugalPost-demographic dividendPre-demographic dividendPuerto RicoQatarRomaniaRussian FederationRwandaSamoaSan MarinoSao Tome and PrincipeSaudi ArabiaSenegalSerbiaSeychellesSierra LeoneSingaporeSlovak RepublicSloveniaSmall statesSolomon IslandsSomaliaSouth AfricaSouth AsiaSouth Asia (IDA & IBRD)South SudanSpainSri LankaSt. Kitts and NevisSt. LuciaSt. Vincent and the GrenadinesSub-Saharan Africa Sub-Saharan Africa (excluding high income)Sub-Saharan Africa (IDA & IBRD countries)SudanSurinameSwazilandSwedenSwitzerlandSyrian Arab RepublicTajikistanTanzaniaThailandTimor-LesteTogoTongaTrinidad and TobagoTunisiaTurkeyTurkmenistanTuvaluUgandaUkraineUnited Arab EmiratesUnited KingdomUnited StatesUpper middle incomeUruguayUzbekistanVanuatuVenezuela, RBVietnamVirgin Islands (U.S.)West Bank and GazaWorldYemen, Rep.ZambiaZimbabwe Timeline:
This timeline shows a graph from 1962 to 2016 of Central African Republic. No data until 1961. Number of actual observations by date: 55.
Source name:
World Development Indicators
Source organization:
World Bank national accounts data, and OECD National Accounts data files.
Categories, topics:
Economy & Growth
Last updated:
apr 23, 2017
Indicators value changes by year
At the date of observation
Value
Absolute change
Change from previous value
jan 1, 1962
4.954
+4.954
0.0%
jan 1, 1963
-3.714
-8.667
-174.97%
jan 1, 1964
-0.707
+3.007
-80.96%
jan 1, 1965
2.08
+2.787
-394.24%
jan 1, 1966
0.948
-1.133
-54.45%
jan 1, 1967
0.645
-0.303
-31.95%
jan 1, 1968
4.677
+4.032
625.3%
jan 1, 1969
1.404
-3.272
-69.98%
jan 1, 1970
7.092
+5.687
405.05%
jan 1, 1971
2.333
-4.759
-67.1%
jan 1, 1972
1.13
-1.203
-51.55%
jan 1, 1973
-0.001
-1.131
-100.08%
jan 1, 1974
1.889
+1.89
-217.93K%
jan 1, 1975
6.339
+4.45
235.59%
jan 1, 1976
0.405
-5.934
-93.61%
jan 1, 1977
5.433
+5.028
1.24K%
jan 1, 1978
3.806
-1.626
-29.94%
jan 1, 1979
1.209
-2.597
-68.23%
jan 1, 1980
-2.465
-3.674
-303.86%
jan 1, 1981
-4.479
-2.014
81.68%
jan 1, 1982
-1.544
+2.934
-65.51%
jan 1, 1983
7.716
+9.26
-599.58%
jan 1, 1984
-8.127
-15.842
-205.32%
jan 1, 1985
9.482
+17.608
-216.68%
jan 1, 1986
3.927
-5.555
-58.58%
jan 1, 1987
3.578
-0.349
-8.89%
jan 1, 1988
-4.939
-8.517
-238.04%
jan 1, 1989
1.71
+6.649
-134.63%
jan 1, 1990
1.977
+0.267
15.62%
jan 1, 1991
-2.148
-4.125
-208.61%
jan 1, 1992
-0.553
+1.595
-74.27%
jan 1, 1993
-6.424
-5.872
1.06K%
jan 1, 1994
0.335
+6.759
-105.22%
jan 1, 1995
4.9
+4.565
1.36K%
jan 1, 1996
7.2
+2.3
46.94%
jan 1, 1997
-4.0
-11.2
-155.56%
jan 1, 1998
5.3
+9.3
-232.5%
jan 1, 1999
4.7
-0.6
-11.32%
jan 1, 2000
3.6
-1.1
-23.41%
jan 1, 2001
-2.489
-6.089
-169.15%
jan 1, 2002
4.465
+6.954
-279.35%
jan 1, 2003
3.617
-0.848
-19.0%
jan 1, 2004
-5.397
-9.014
-249.24%
jan 1, 2005
5.995
+11.392
-211.07%
jan 1, 2006
0.908
-5.087
-84.85%
jan 1, 2007
4.771
+3.863
425.33%
jan 1, 2008
4.608
-0.164
-3.43%
jan 1, 2009
2.054
-2.553
-55.42%
jan 1, 2010
1.709
-0.345
-16.79%
jan 1, 2011
3.047
+1.337
78.25%
jan 1, 2012
3.301
+0.254
8.34%
jan 1, 2013
4.113
+0.812
24.6%
jan 1, 2014
-36.7
-40.813
-992.34%
jan 1, 2015
1.04
+37.74
-102.83%
jan 1, 2016
4.8
+3.76
361.52%
Ranking of countries by current statistics by years


Comments: