29
/
en
AIzaSyAYiBZKx7MnpbEhh9jyipgxe19OcubqV5w
April 1, 2024
67153
Andorra
AND
true
2
1
GDP growth (annual %)
2014,2013,2012,2011,2010,2009,2008,2007,2006,2005,2004,2003,2002,2001,2000,1999,1998,1997,1996,1995,1994,1993,1992,1991,1990,1989,1988,1987,1986,1985,1984,1983,1982,1981,1980,1979,1978,1977,1976,1975,1974,1973,1972
This statistics in other country:
AfghanistanAlbaniaAlgeriaAndorraAngolaAntigua and BarbudaArab WorldArgentinaArmeniaArubaAustraliaAustriaAzerbaijanBahamas, TheBahrainBangladeshBarbadosBelarusBelgiumBelizeBeninBermudaBhutanBoliviaBosnia and HerzegovinaBotswanaBrazilBrunei DarussalamBulgariaBurkina FasoBurundiCabo VerdeCambodiaCameroonCanadaCaribbean small statesCayman IslandsCentral African RepublicCentral Europe and the BalticsChadChannel IslandsChileChinaColombiaComorosCongo, Dem. Rep.Congo, Rep.Costa RicaCote d'IvoireCroatiaCubaCyprusCzech RepublicDenmarkDjiboutiDominicaDominican RepublicEarly-demographic dividendEast Asia & PacificEast Asia & Pacific (excluding high income)East Asia & Pacific (IDA & IBRD countries)EcuadorEgypt, Arab Rep.El SalvadorEquatorial GuineaEritreaEstoniaEthiopiaEuro areaEurope & Central AsiaEurope & Central Asia (excluding high income)Europe & Central Asia (IDA & IBRD countries)European UnionFijiFinlandFragile and conflict affected situationsFranceFrench PolynesiaGabonGambia, TheGeorgiaGermanyGhanaGreeceGreenlandGrenadaGuatemalaGuineaGuinea-BissauGuyanaHaitiHeavily indebted poor countries (HIPC)High incomeHondurasHong Kong SAR, ChinaHungaryIBRD onlyIcelandIDA & IBRD totalIDA blendIDA onlyIDA totalIndiaIndonesiaIran, Islamic Rep.IraqIrelandIsle of ManIsraelItalyJamaicaJapanJordanKazakhstanKenyaKiribatiKorea, Rep.KosovoKuwaitKyrgyz RepublicLao PDRLate-demographic dividendLatin America & Caribbean Latin America & Caribbean (excluding high income)Latin America & the Caribbean (IDA & IBRD countries)LatviaLeast developed countries: UN classificationLebanonLesothoLiberiaLibyaLiechtensteinLithuaniaLow & middle incomeLow incomeLower middle incomeLuxembourgMacao SAR, ChinaMacedonia, FYRMadagascarMalawiMalaysiaMaldivesMaliMaltaMarshall IslandsMauritaniaMauritiusMexicoMicronesia, Fed. Sts.Middle East & North AfricaMiddle East & North Africa (excluding high income)Middle East & North Africa (IDA & IBRD countries)Middle incomeMoldovaMonacoMongoliaMontenegroMoroccoMozambiqueMyanmarNamibiaNauruNepalNetherlandsNew CaledoniaNew ZealandNicaraguaNigerNigeriaNorth AmericaNorwayOECD membersOmanOther small statesPacific island small statesPakistanPalauPanamaPapua New GuineaParaguayPeruPhilippinesPolandPortugalPost-demographic dividendPre-demographic dividendPuerto RicoQatarRomaniaRussian FederationRwandaSamoaSan MarinoSao Tome and PrincipeSaudi ArabiaSenegalSerbiaSeychellesSierra LeoneSingaporeSlovak RepublicSloveniaSmall statesSolomon IslandsSomaliaSouth AfricaSouth AsiaSouth Asia (IDA & IBRD)South SudanSpainSri LankaSt. Kitts and NevisSt. LuciaSt. Vincent and the GrenadinesSub-Saharan Africa Sub-Saharan Africa (excluding high income)Sub-Saharan Africa (IDA & IBRD countries)SudanSurinameSwazilandSwedenSwitzerlandSyrian Arab RepublicTajikistanTanzaniaThailandTimor-LesteTogoTongaTrinidad and TobagoTunisiaTurkeyTurkmenistanTuvaluUgandaUkraineUnited Arab EmiratesUnited KingdomUnited StatesUpper middle incomeUruguayUzbekistanVanuatuVenezuela, RBVietnamVirgin Islands (U.S.)West Bank and GazaWorldYemen, Rep.ZambiaZimbabwe Timeline:
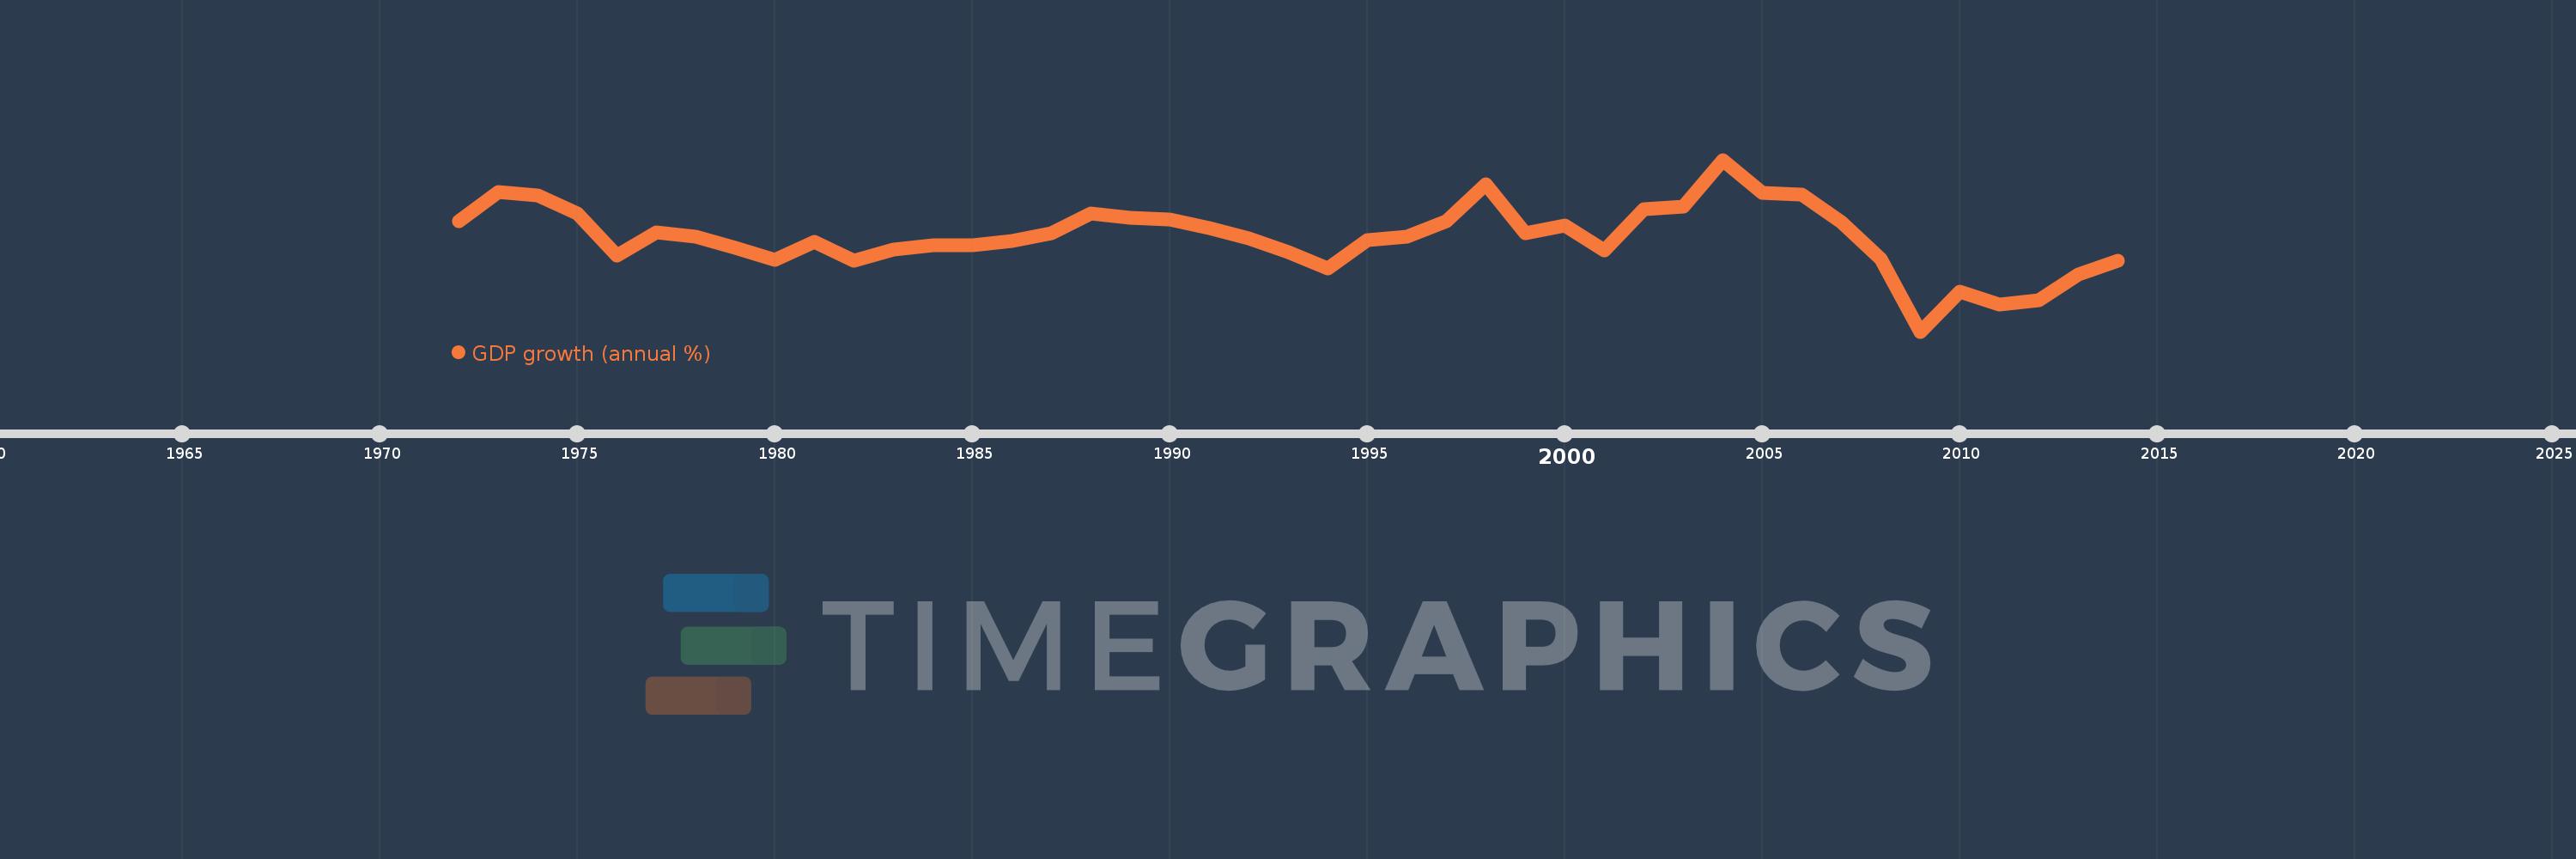
This timeline shows a graph from 1972 to 2014 of Andorra. No data until 1971. Number of actual observations by date: 43.
Source name:
World Development Indicators
Source organization:
World Bank national accounts data, and OECD National Accounts data files.
Categories, topics:
Economy & Growth
Last updated:
apr 23, 2017
Indicators value changes by year
Minimum:
-8.594
jan 1, 2009
Maximum:
12.024
jan 1, 2004
At the date of observation
Value
Absolute change
Change from previous value
jan 1, 1972
4.649
+4.649
0.0%
jan 1, 1973
8.15
+3.5
75.28%
jan 1, 1974
7.788
-0.361
-4.43%
jan 1, 1975
5.619
-2.17
-27.86%
jan 1, 1976
0.542
-5.077
-90.35%
jan 1, 1977
3.304
+2.762
509.32%
jan 1, 1978
2.839
-0.465
-14.08%
jan 1, 1979
1.463
-1.376
-48.46%
jan 1, 1980
0.042
-1.421
-97.16%
jan 1, 1981
2.209
+2.167
5.21K%
jan 1, 1982
-0.132
-2.341
-106.0%
jan 1, 1983
1.246
+1.379
-1.04K%
jan 1, 1984
1.77
+0.524
42.01%
jan 1, 1985
1.785
+0.015
0.82%
jan 1, 1986
2.321
+0.537
30.08%
jan 1, 1987
3.253
+0.932
40.14%
jan 1, 1988
5.547
+2.294
70.51%
jan 1, 1989
5.094
-0.453
-8.16%
jan 1, 1990
4.827
-0.267
-5.25%
jan 1, 1991
3.781
-1.046
-21.66%
jan 1, 1992
2.546
-1.235
-32.67%
jan 1, 1993
0.929
-1.617
-63.5%
jan 1, 1994
-1.031
-1.961
-211.01%
jan 1, 1995
2.383
+3.415
-331.04%
jan 1, 1996
2.757
+0.374
15.71%
jan 1, 1997
4.65
+1.892
68.62%
jan 1, 1998
9.068
+4.418
95.01%
jan 1, 1999
3.195
-5.873
-64.77%
jan 1, 2000
4.099
+0.904
28.31%
jan 1, 2001
1.166
-2.933
-71.56%
jan 1, 2002
6.067
+4.901
420.4%
jan 1, 2003
6.427
+0.36
5.94%
jan 1, 2004
12.024
+5.597
87.09%
jan 1, 2005
8.07
-3.954
-32.89%
jan 1, 2006
7.84
-0.23
-2.85%
jan 1, 2007
4.585
-3.254
-41.51%
jan 1, 2008
0.078
-4.507
-98.3%
jan 1, 2009
-8.594
-8.672
-11.11K%
jan 1, 2010
-3.818
+4.776
-55.58%
jan 1, 2011
-5.348
-1.53
40.07%
jan 1, 2012
-4.803
+0.545
-10.2%
jan 1, 2013
-1.76
+3.043
-63.35%
jan 1, 2014
-0.064
+1.696
-96.39%
Ranking of countries by current statistics by years


Comments: