29
/
en
AIzaSyAYiBZKx7MnpbEhh9jyipgxe19OcubqV5w
April 1, 2024
249873
St. Kitts and Nevis
KNA
true
2
1
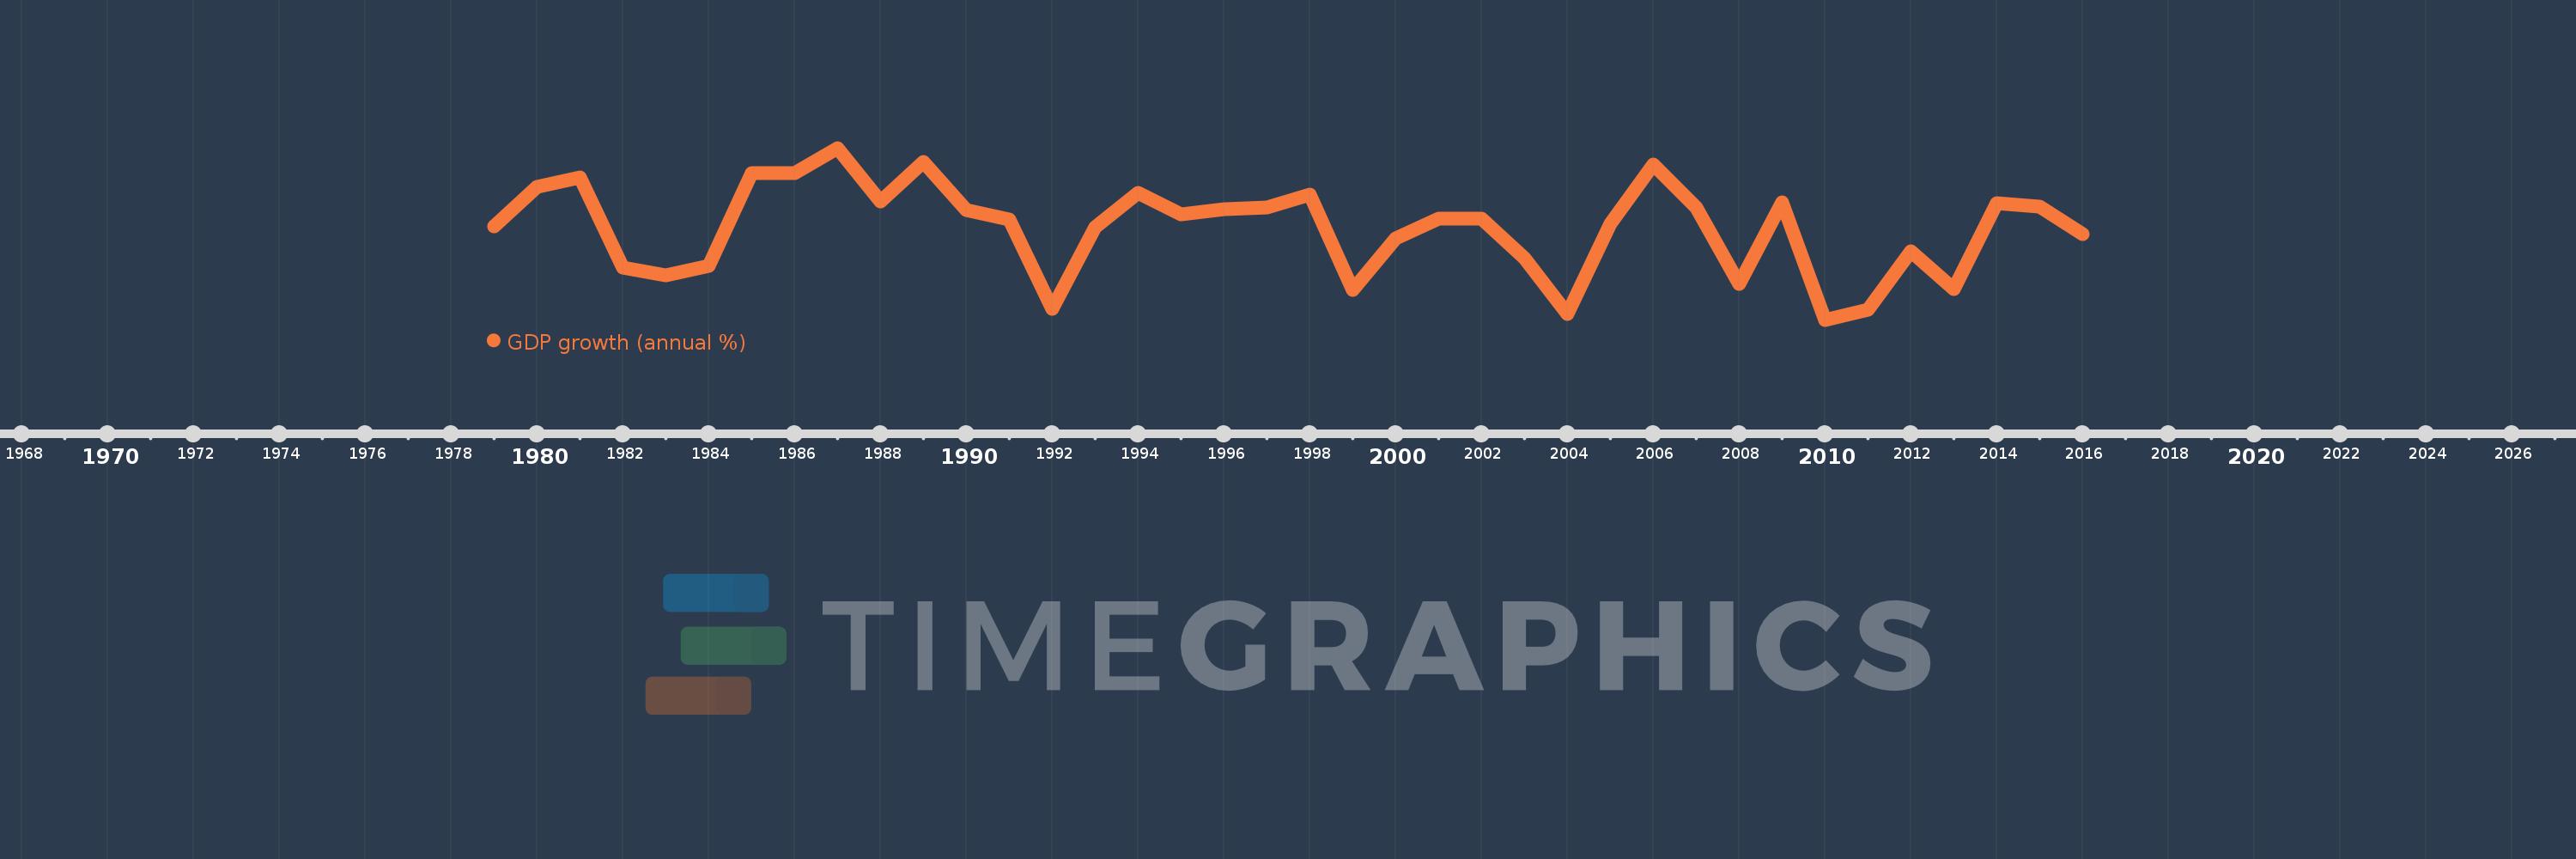
GDP growth (annual %)
2016,2015,2014,2013,2012,2011,2010,2009,2008,2007,2006,2005,2004,2003,2002,2001,2000,1999,1998,1997,1996,1995,1994,1993,1992,1991,1990,1989,1988,1987,1986,1985,1984,1983,1982,1981,1980,1979
This statistics in other country:
AfghanistanAlbaniaAlgeriaAndorraAngolaAntigua and BarbudaArab WorldArgentinaArmeniaArubaAustraliaAustriaAzerbaijanBahamas, TheBahrainBangladeshBarbadosBelarusBelgiumBelizeBeninBermudaBhutanBoliviaBosnia and HerzegovinaBotswanaBrazilBrunei DarussalamBulgariaBurkina FasoBurundiCabo VerdeCambodiaCameroonCanadaCaribbean small statesCayman IslandsCentral African RepublicCentral Europe and the BalticsChadChannel IslandsChileChinaColombiaComorosCongo, Dem. Rep.Congo, Rep.Costa RicaCote d'IvoireCroatiaCubaCyprusCzech RepublicDenmarkDjiboutiDominicaDominican RepublicEarly-demographic dividendEast Asia & PacificEast Asia & Pacific (excluding high income)East Asia & Pacific (IDA & IBRD countries)EcuadorEgypt, Arab Rep.El SalvadorEquatorial GuineaEritreaEstoniaEthiopiaEuro areaEurope & Central AsiaEurope & Central Asia (excluding high income)Europe & Central Asia (IDA & IBRD countries)European UnionFijiFinlandFragile and conflict affected situationsFranceFrench PolynesiaGabonGambia, TheGeorgiaGermanyGhanaGreeceGreenlandGrenadaGuatemalaGuineaGuinea-BissauGuyanaHaitiHeavily indebted poor countries (HIPC)High incomeHondurasHong Kong SAR, ChinaHungaryIBRD onlyIcelandIDA & IBRD totalIDA blendIDA onlyIDA totalIndiaIndonesiaIran, Islamic Rep.IraqIrelandIsle of ManIsraelItalyJamaicaJapanJordanKazakhstanKenyaKiribatiKorea, Rep.KosovoKuwaitKyrgyz RepublicLao PDRLate-demographic dividendLatin America & Caribbean Latin America & Caribbean (excluding high income)Latin America & the Caribbean (IDA & IBRD countries)LatviaLeast developed countries: UN classificationLebanonLesothoLiberiaLibyaLiechtensteinLithuaniaLow & middle incomeLow incomeLower middle incomeLuxembourgMacao SAR, ChinaMacedonia, FYRMadagascarMalawiMalaysiaMaldivesMaliMaltaMarshall IslandsMauritaniaMauritiusMexicoMicronesia, Fed. Sts.Middle East & North AfricaMiddle East & North Africa (excluding high income)Middle East & North Africa (IDA & IBRD countries)Middle incomeMoldovaMonacoMongoliaMontenegroMoroccoMozambiqueMyanmarNamibiaNauruNepalNetherlandsNew CaledoniaNew ZealandNicaraguaNigerNigeriaNorth AmericaNorwayOECD membersOmanOther small statesPacific island small statesPakistanPalauPanamaPapua New GuineaParaguayPeruPhilippinesPolandPortugalPost-demographic dividendPre-demographic dividendPuerto RicoQatarRomaniaRussian FederationRwandaSamoaSan MarinoSao Tome and PrincipeSaudi ArabiaSenegalSerbiaSeychellesSierra LeoneSingaporeSlovak RepublicSloveniaSmall statesSolomon IslandsSomaliaSouth AfricaSouth AsiaSouth Asia (IDA & IBRD)South SudanSpainSri LankaSt. Kitts and NevisSt. LuciaSt. Vincent and the GrenadinesSub-Saharan Africa Sub-Saharan Africa (excluding high income)Sub-Saharan Africa (IDA & IBRD countries)SudanSurinameSwazilandSwedenSwitzerlandSyrian Arab RepublicTajikistanTanzaniaThailandTimor-LesteTogoTongaTrinidad and TobagoTunisiaTurkeyTurkmenistanTuvaluUgandaUkraineUnited Arab EmiratesUnited KingdomUnited StatesUpper middle incomeUruguayUzbekistanVanuatuVenezuela, RBVietnamVirgin Islands (U.S.)West Bank and GazaWorldYemen, Rep.ZambiaZimbabwe Timeline:
This timeline shows a graph from 1979 to 2016 of St. Kitts and Nevis. No data until 1978. Number of actual observations by date: 38.
Source name:
World Development Indicators
Source organization:
World Bank national accounts data, and OECD National Accounts data files.
Categories, topics:
Economy & Growth
Last updated:
apr 23, 2017
Indicators value changes by year
Maximum:
10.584
jan 1, 1987
At the date of observation
Value
Absolute change
Change from previous value
jan 1, 1979
4.38
+4.38
0.0%
jan 1, 1980
7.474
+3.094
70.63%
jan 1, 1981
8.28
+0.806
10.78%
jan 1, 1982
1.127
-7.153
-86.39%
jan 1, 1983
0.474
-0.652
-57.91%
jan 1, 1984
1.246
+0.772
162.69%
jan 1, 1985
8.622
+7.376
592.05%
jan 1, 1986
8.614
-0.008
-0.09%
jan 1, 1987
10.584
+1.969
22.86%
jan 1, 1988
6.349
-4.234
-40.01%
jan 1, 1989
9.509
+3.16
49.76%
jan 1, 1990
5.646
-3.863
-40.63%
jan 1, 1991
4.891
-0.755
-13.37%
jan 1, 1992
-2.148
-7.039
-143.93%
jan 1, 1993
4.277
+6.426
-299.1%
jan 1, 1994
7.005
+2.728
63.78%
jan 1, 1995
5.313
-1.692
-24.16%
jan 1, 1996
5.753
+0.44
8.28%
jan 1, 1997
5.886
+0.133
2.32%
jan 1, 1998
6.896
+1.01
17.16%
jan 1, 1999
-0.667
-7.564
-109.68%
jan 1, 2000
3.388
+4.056
-607.78%
jan 1, 2001
5.019
+1.63
48.12%
jan 1, 2002
4.978
-0.041
-0.81%
jan 1, 2003
1.839
-3.14
-63.07%
jan 1, 2004
-2.549
-4.387
-238.63%
jan 1, 2005
4.605
+7.154
-280.68%
jan 1, 2006
9.259
+4.654
101.05%
jan 1, 2007
5.885
-3.373
-36.44%
jan 1, 2008
-0.153
-6.039
-102.61%
jan 1, 2009
6.292
+6.445
-4.2K%
jan 1, 2010
-3.02
-9.312
-148.0%
jan 1, 2011
-2.249
+0.771
-25.53%
jan 1, 2012
2.399
+4.648
-206.65%
jan 1, 2013
-0.601
-2.999
-125.04%
jan 1, 2014
6.22
+6.82
-1.14K%
jan 1, 2015
5.963
-0.257
-4.13%
jan 1, 2016
3.763
-2.2
-36.9%
Ranking of countries by current statistics by years


Comments: