29
/
en
AIzaSyAYiBZKx7MnpbEhh9jyipgxe19OcubqV5w
April 1, 2024
255171
Swaziland
SWZ
true
2
1
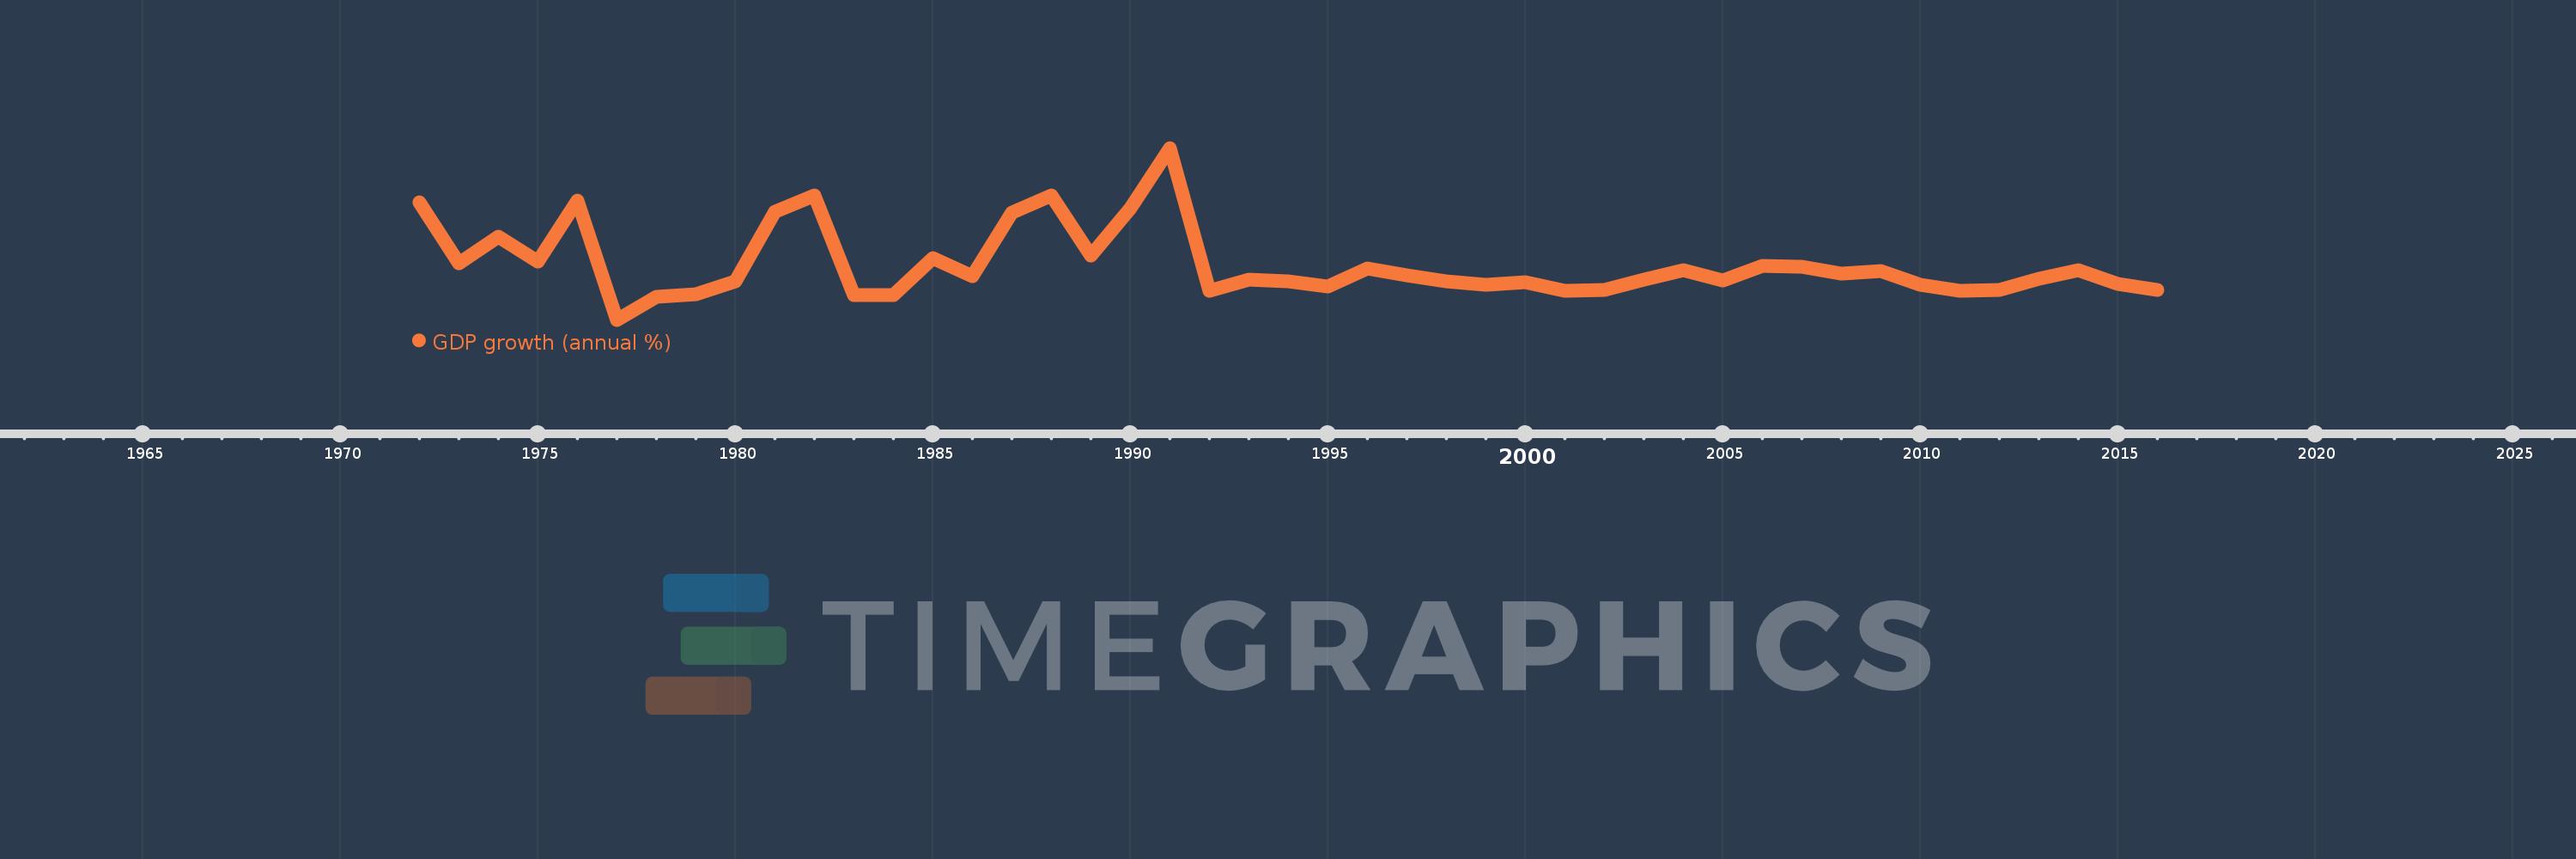
GDP growth (annual %)
2016,2015,2014,2013,2012,2011,2010,2009,2008,2007,2006,2005,2004,2003,2002,2001,2000,1999,1998,1997,1996,1995,1994,1993,1992,1991,1990,1989,1988,1987,1986,1985,1984,1983,1982,1981,1980,1979,1978,1977,1976,1975,1974,1973,1972
This statistics in other country:
AfghanistanAlbaniaAlgeriaAndorraAngolaAntigua and BarbudaArab WorldArgentinaArmeniaArubaAustraliaAustriaAzerbaijanBahamas, TheBahrainBangladeshBarbadosBelarusBelgiumBelizeBeninBermudaBhutanBoliviaBosnia and HerzegovinaBotswanaBrazilBrunei DarussalamBulgariaBurkina FasoBurundiCabo VerdeCambodiaCameroonCanadaCaribbean small statesCayman IslandsCentral African RepublicCentral Europe and the BalticsChadChannel IslandsChileChinaColombiaComorosCongo, Dem. Rep.Congo, Rep.Costa RicaCote d'IvoireCroatiaCubaCyprusCzech RepublicDenmarkDjiboutiDominicaDominican RepublicEarly-demographic dividendEast Asia & PacificEast Asia & Pacific (excluding high income)East Asia & Pacific (IDA & IBRD countries)EcuadorEgypt, Arab Rep.El SalvadorEquatorial GuineaEritreaEstoniaEthiopiaEuro areaEurope & Central AsiaEurope & Central Asia (excluding high income)Europe & Central Asia (IDA & IBRD countries)European UnionFijiFinlandFragile and conflict affected situationsFranceFrench PolynesiaGabonGambia, TheGeorgiaGermanyGhanaGreeceGreenlandGrenadaGuatemalaGuineaGuinea-BissauGuyanaHaitiHeavily indebted poor countries (HIPC)High incomeHondurasHong Kong SAR, ChinaHungaryIBRD onlyIcelandIDA & IBRD totalIDA blendIDA onlyIDA totalIndiaIndonesiaIran, Islamic Rep.IraqIrelandIsle of ManIsraelItalyJamaicaJapanJordanKazakhstanKenyaKiribatiKorea, Rep.KosovoKuwaitKyrgyz RepublicLao PDRLate-demographic dividendLatin America & Caribbean Latin America & Caribbean (excluding high income)Latin America & the Caribbean (IDA & IBRD countries)LatviaLeast developed countries: UN classificationLebanonLesothoLiberiaLibyaLiechtensteinLithuaniaLow & middle incomeLow incomeLower middle incomeLuxembourgMacao SAR, ChinaMacedonia, FYRMadagascarMalawiMalaysiaMaldivesMaliMaltaMarshall IslandsMauritaniaMauritiusMexicoMicronesia, Fed. Sts.Middle East & North AfricaMiddle East & North Africa (excluding high income)Middle East & North Africa (IDA & IBRD countries)Middle incomeMoldovaMonacoMongoliaMontenegroMoroccoMozambiqueMyanmarNamibiaNauruNepalNetherlandsNew CaledoniaNew ZealandNicaraguaNigerNigeriaNorth AmericaNorwayOECD membersOmanOther small statesPacific island small statesPakistanPalauPanamaPapua New GuineaParaguayPeruPhilippinesPolandPortugalPost-demographic dividendPre-demographic dividendPuerto RicoQatarRomaniaRussian FederationRwandaSamoaSan MarinoSao Tome and PrincipeSaudi ArabiaSenegalSerbiaSeychellesSierra LeoneSingaporeSlovak RepublicSloveniaSmall statesSolomon IslandsSomaliaSouth AfricaSouth AsiaSouth Asia (IDA & IBRD)South SudanSpainSri LankaSt. Kitts and NevisSt. LuciaSt. Vincent and the GrenadinesSub-Saharan Africa Sub-Saharan Africa (excluding high income)Sub-Saharan Africa (IDA & IBRD countries)SudanSurinameSwazilandSwedenSwitzerlandSyrian Arab RepublicTajikistanTanzaniaThailandTimor-LesteTogoTongaTrinidad and TobagoTunisiaTurkeyTurkmenistanTuvaluUgandaUkraineUnited Arab EmiratesUnited KingdomUnited StatesUpper middle incomeUruguayUzbekistanVanuatuVenezuela, RBVietnamVirgin Islands (U.S.)West Bank and GazaWorldYemen, Rep.ZambiaZimbabwe Timeline:
This timeline shows a graph from 1972 to 2016 of Swaziland. No data until 1971. Number of actual observations by date: 45.
Source name:
World Development Indicators
Source organization:
World Bank national accounts data, and OECD National Accounts data files.
Categories, topics:
Economy & Growth
Last updated:
apr 23, 2017
Indicators value changes by year
Minimum:
-2.119
jan 1, 1977
Maximum:
21.018
jan 1, 1991
At the date of observation
Value
Absolute change
Change from previous value
jan 1, 1972
13.744
+13.744
0.0%
jan 1, 1973
5.424
-8.319
-60.53%
jan 1, 1974
9.019
+3.594
66.26%
jan 1, 1975
5.743
-3.275
-36.32%
jan 1, 1976
13.908
+8.165
142.16%
jan 1, 1977
-2.119
-16.028
-115.24%
jan 1, 1978
1.01
+3.129
-147.63%
jan 1, 1979
1.327
+0.318
31.45%
jan 1, 1980
3.107
+1.78
134.11%
jan 1, 1981
12.449
+9.342
300.68%
jan 1, 1982
14.641
+2.192
17.61%
jan 1, 1983
1.173
-13.469
-91.99%
jan 1, 1984
1.202
+0.03
2.54%
jan 1, 1985
6.162
+4.959
412.47%
jan 1, 1986
3.792
-2.369
-38.45%
jan 1, 1987
12.264
+8.472
223.39%
jan 1, 1988
14.607
+2.342
19.1%
jan 1, 1989
6.57
-8.037
-55.02%
jan 1, 1990
12.911
+6.341
96.52%
jan 1, 1991
21.018
+8.107
62.79%
jan 1, 1992
1.76
-19.258
-91.62%
jan 1, 1993
3.226
+1.466
83.27%
jan 1, 1994
3.106
-0.12
-3.72%
jan 1, 1995
2.401
-0.705
-22.71%
jan 1, 1996
4.826
+2.425
101.01%
jan 1, 1997
3.842
-0.984
-20.38%
jan 1, 1998
3.103
-0.739
-19.24%
jan 1, 1999
2.604
-0.499
-16.07%
jan 1, 2000
2.951
+0.347
13.32%
jan 1, 2001
1.76
-1.191
-40.35%
jan 1, 2002
1.898
+0.137
7.8%
jan 1, 2003
3.244
+1.346
70.95%
jan 1, 2004
4.555
+1.311
40.42%
jan 1, 2005
3.113
-1.442
-31.65%
jan 1, 2006
5.192
+2.079
66.77%
jan 1, 2007
5.074
-0.117
-2.26%
jan 1, 2008
4.054
-1.021
-20.11%
jan 1, 2009
4.423
+0.37
9.12%
jan 1, 2010
2.57
-1.854
-41.9%
jan 1, 2011
1.812
-0.758
-29.49%
jan 1, 2012
1.902
+0.09
4.95%
jan 1, 2013
3.428
+1.526
80.25%
jan 1, 2014
4.574
+1.146
33.42%
jan 1, 2015
2.748
-1.825
-39.9%
jan 1, 2016
1.867
-0.881
-32.06%
Ranking of countries by current statistics by years


Comments: