29
/
en
AIzaSyAYiBZKx7MnpbEhh9jyipgxe19OcubqV5w
April 1, 2024
34962
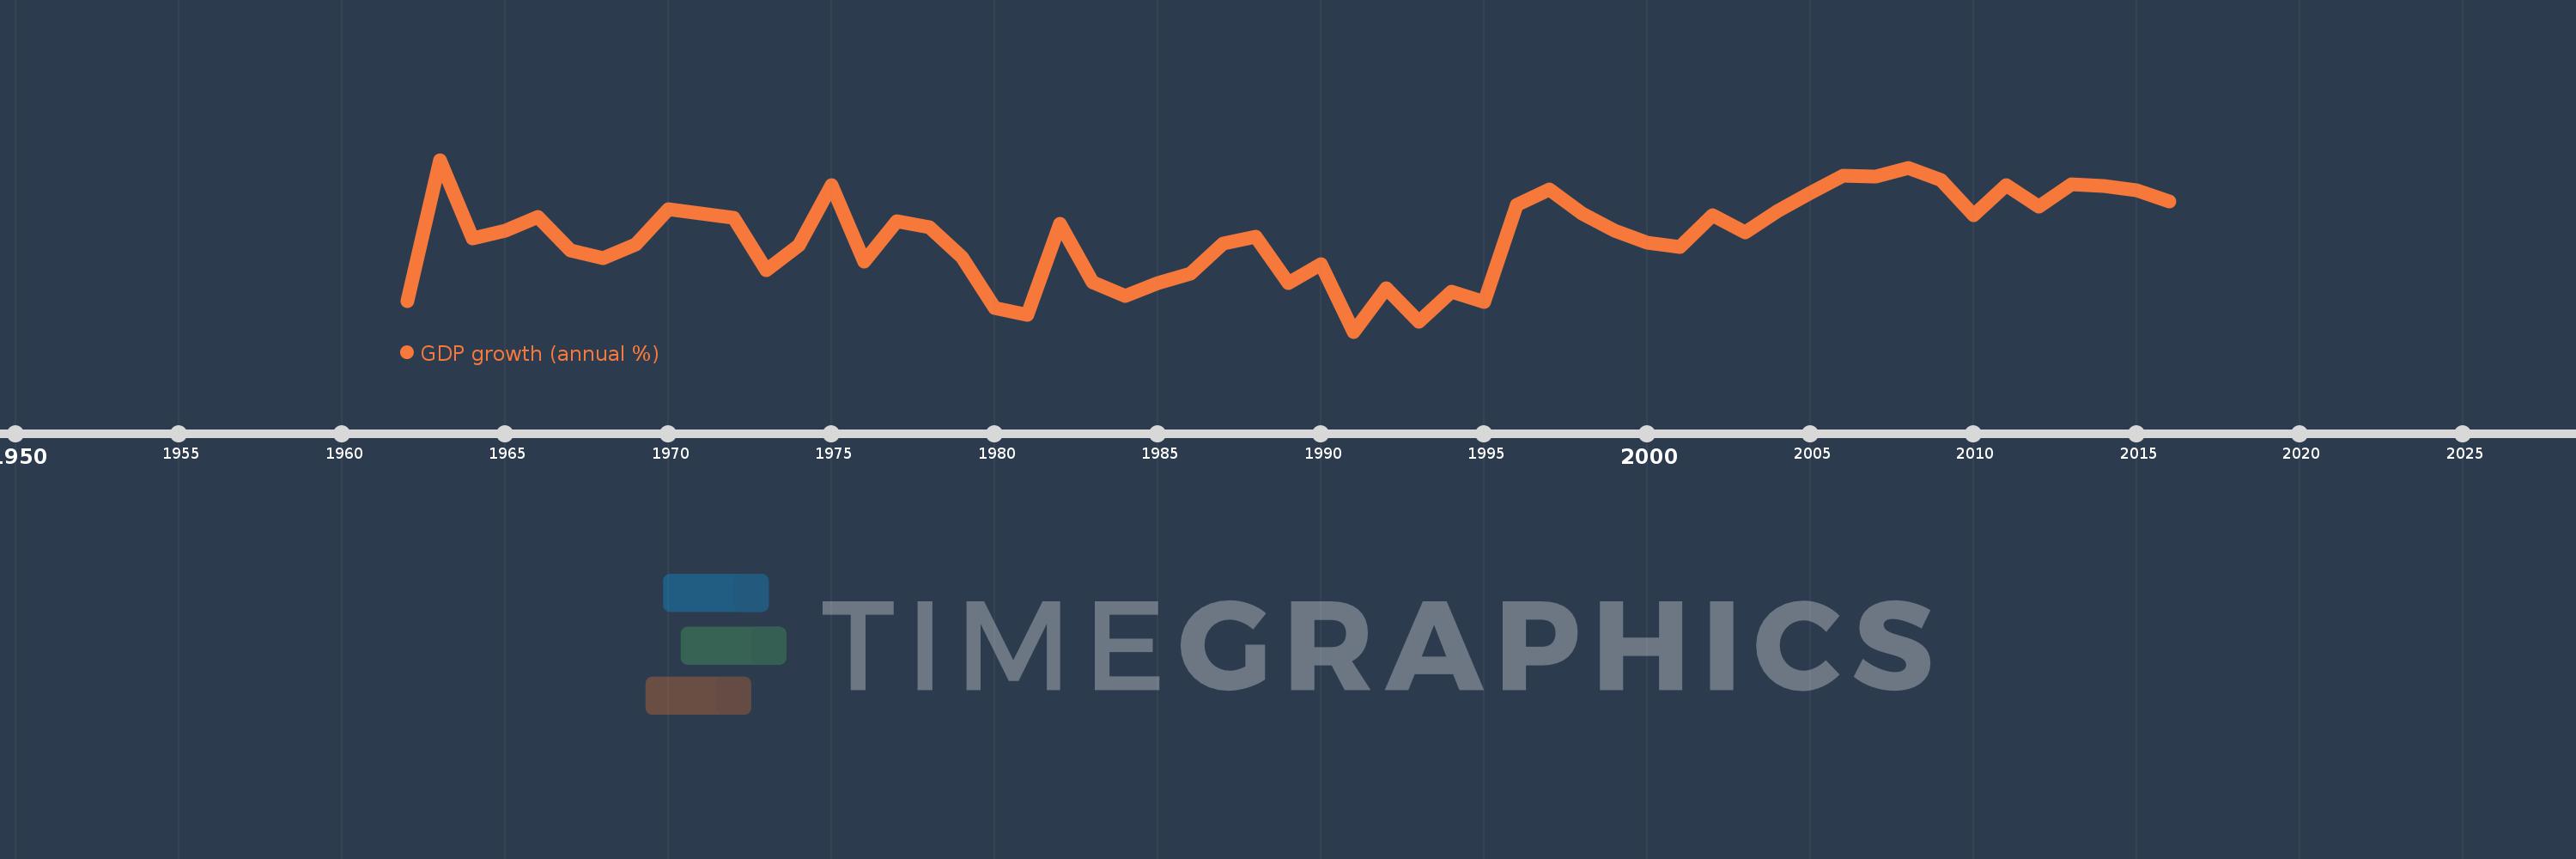
Heavily indebted poor countries (HIPC)
HPC
false
2
1
GDP growth (annual %)
2016,2015,2014,2013,2012,2011,2010,2009,2008,2007,2006,2005,2004,2003,2002,2001,2000,1999,1998,1997,1996,1995,1994,1993,1992,1991,1990,1989,1988,1987,1986,1985,1984,1983,1982,1981,1980,1979,1978,1977,1976,1975,1974,1973,1972,1971,1970,1969,1968,1967,1966,1965,1964,1963,1962
This statistics in other country:
AfghanistanAlbaniaAlgeriaAndorraAngolaAntigua and BarbudaArab WorldArgentinaArmeniaArubaAustraliaAustriaAzerbaijanBahamas, TheBahrainBangladeshBarbadosBelarusBelgiumBelizeBeninBermudaBhutanBoliviaBosnia and HerzegovinaBotswanaBrazilBrunei DarussalamBulgariaBurkina FasoBurundiCabo VerdeCambodiaCameroonCanadaCaribbean small statesCayman IslandsCentral African RepublicCentral Europe and the BalticsChadChannel IslandsChileChinaColombiaComorosCongo, Dem. Rep.Congo, Rep.Costa RicaCote d'IvoireCroatiaCubaCyprusCzech RepublicDenmarkDjiboutiDominicaDominican RepublicEarly-demographic dividendEast Asia & PacificEast Asia & Pacific (excluding high income)East Asia & Pacific (IDA & IBRD countries)EcuadorEgypt, Arab Rep.El SalvadorEquatorial GuineaEritreaEstoniaEthiopiaEuro areaEurope & Central AsiaEurope & Central Asia (excluding high income)Europe & Central Asia (IDA & IBRD countries)European UnionFijiFinlandFragile and conflict affected situationsFranceFrench PolynesiaGabonGambia, TheGeorgiaGermanyGhanaGreeceGreenlandGrenadaGuatemalaGuineaGuinea-BissauGuyanaHaitiHeavily indebted poor countries (HIPC)High incomeHondurasHong Kong SAR, ChinaHungaryIBRD onlyIcelandIDA & IBRD totalIDA blendIDA onlyIDA totalIndiaIndonesiaIran, Islamic Rep.IraqIrelandIsle of ManIsraelItalyJamaicaJapanJordanKazakhstanKenyaKiribatiKorea, Rep.KosovoKuwaitKyrgyz RepublicLao PDRLate-demographic dividendLatin America & Caribbean Latin America & Caribbean (excluding high income)Latin America & the Caribbean (IDA & IBRD countries)LatviaLeast developed countries: UN classificationLebanonLesothoLiberiaLibyaLiechtensteinLithuaniaLow & middle incomeLow incomeLower middle incomeLuxembourgMacao SAR, ChinaMacedonia, FYRMadagascarMalawiMalaysiaMaldivesMaliMaltaMarshall IslandsMauritaniaMauritiusMexicoMicronesia, Fed. Sts.Middle East & North AfricaMiddle East & North Africa (excluding high income)Middle East & North Africa (IDA & IBRD countries)Middle incomeMoldovaMonacoMongoliaMontenegroMoroccoMozambiqueMyanmarNamibiaNauruNepalNetherlandsNew CaledoniaNew ZealandNicaraguaNigerNigeriaNorth AmericaNorwayOECD membersOmanOther small statesPacific island small statesPakistanPalauPanamaPapua New GuineaParaguayPeruPhilippinesPolandPortugalPost-demographic dividendPre-demographic dividendPuerto RicoQatarRomaniaRussian FederationRwandaSamoaSan MarinoSao Tome and PrincipeSaudi ArabiaSenegalSerbiaSeychellesSierra LeoneSingaporeSlovak RepublicSloveniaSmall statesSolomon IslandsSomaliaSouth AfricaSouth AsiaSouth Asia (IDA & IBRD)South SudanSpainSri LankaSt. Kitts and NevisSt. LuciaSt. Vincent and the GrenadinesSub-Saharan Africa Sub-Saharan Africa (excluding high income)Sub-Saharan Africa (IDA & IBRD countries)SudanSurinameSwazilandSwedenSwitzerlandSyrian Arab RepublicTajikistanTanzaniaThailandTimor-LesteTogoTongaTrinidad and TobagoTunisiaTurkeyTurkmenistanTuvaluUgandaUkraineUnited Arab EmiratesUnited KingdomUnited StatesUpper middle incomeUruguayUzbekistanVanuatuVenezuela, RBVietnamVirgin Islands (U.S.)West Bank and GazaWorldYemen, Rep.ZambiaZimbabwe Timeline:
This timeline shows a graph from 1962 to 2016 of Heavily indebted poor countries (HIPC). No data until 1961. Number of actual observations by date: 55.
Source name:
World Development Indicators
Source organization:
World Bank national accounts data, and OECD National Accounts data files.
Categories, topics:
Economy & Growth
Last updated:
apr 23, 2017
Indicators value changes by year
Minimum:
-1.081
jan 1, 1991
At the date of observation
Value
Absolute change
Change from previous value
jan 1, 1962
0.335
+0.335
0.0%
jan 1, 1963
6.895
+6.559
1.96K%
jan 1, 1964
3.246
-3.649
-52.92%
jan 1, 1965
3.595
+0.349
10.76%
jan 1, 1966
4.254
+0.658
18.3%
jan 1, 1967
2.697
-1.557
-36.6%
jan 1, 1968
2.34
-0.356
-13.21%
jan 1, 1969
2.955
+0.615
26.28%
jan 1, 1970
4.601
+1.645
55.67%
jan 1, 1971
4.393
-0.207
-4.51%
jan 1, 1972
4.196
-0.197
-4.49%
jan 1, 1973
1.765
-2.431
-57.93%
jan 1, 1974
2.91
+1.144
64.82%
jan 1, 1975
5.71
+2.8
96.24%
jan 1, 1976
2.156
-3.554
-62.25%
jan 1, 1977
4.06
+1.904
88.32%
jan 1, 1978
3.775
-0.285
-7.01%
jan 1, 1979
2.366
-1.409
-37.33%
jan 1, 1980
0.004
-2.362
-99.85%
jan 1, 1981
-0.317
-0.321
-8.81K%
jan 1, 1982
3.918
+4.235
-1.34K%
jan 1, 1983
1.214
-2.704
-69.01%
jan 1, 1984
0.591
-0.623
-51.34%
jan 1, 1985
1.18
+0.589
99.74%
jan 1, 1986
1.609
+0.429
36.33%
jan 1, 1987
3.022
+1.414
87.88%
jan 1, 1988
3.343
+0.32
10.6%
jan 1, 1989
1.189
-2.154
-64.43%
jan 1, 1990
2.062
+0.873
73.45%
jan 1, 1991
-1.081
-3.144
-152.43%
jan 1, 1992
0.916
+1.997
-184.68%
jan 1, 1993
-0.616
-1.531
-167.24%
jan 1, 1994
0.763
+1.379
-223.97%
jan 1, 1995
0.304
-0.459
-60.18%
jan 1, 1996
4.806
+4.502
1.48K%
jan 1, 1997
5.502
+0.696
14.48%
jan 1, 1998
4.403
-1.099
-19.97%
jan 1, 1999
3.59
-0.814
-18.48%
jan 1, 2000
3.051
-0.539
-15.01%
jan 1, 2001
2.843
-0.208
-6.83%
jan 1, 2002
4.309
+1.466
51.58%
jan 1, 2003
3.523
-0.786
-18.25%
jan 1, 2004
4.54
+1.017
28.87%
jan 1, 2005
5.375
+0.835
18.39%
jan 1, 2006
6.162
+0.788
14.65%
jan 1, 2007
6.12
-0.043
-0.69%
jan 1, 2008
6.515
+0.395
6.46%
jan 1, 2009
5.977
-0.537
-8.25%
jan 1, 2010
4.323
-1.654
-27.68%
jan 1, 2011
5.7
+1.378
31.87%
jan 1, 2012
4.707
-0.993
-17.42%
jan 1, 2013
5.767
+1.06
22.52%
jan 1, 2014
5.683
-0.085
-1.47%
jan 1, 2015
5.467
-0.216
-3.8%
jan 1, 2016
4.98
-0.486
-8.9%
Ranking of countries by current statistics by years


Comments: