29
/
en
AIzaSyAYiBZKx7MnpbEhh9jyipgxe19OcubqV5w
April 1, 2024
37356
IDA & IBRD total
IBT
false
2
1
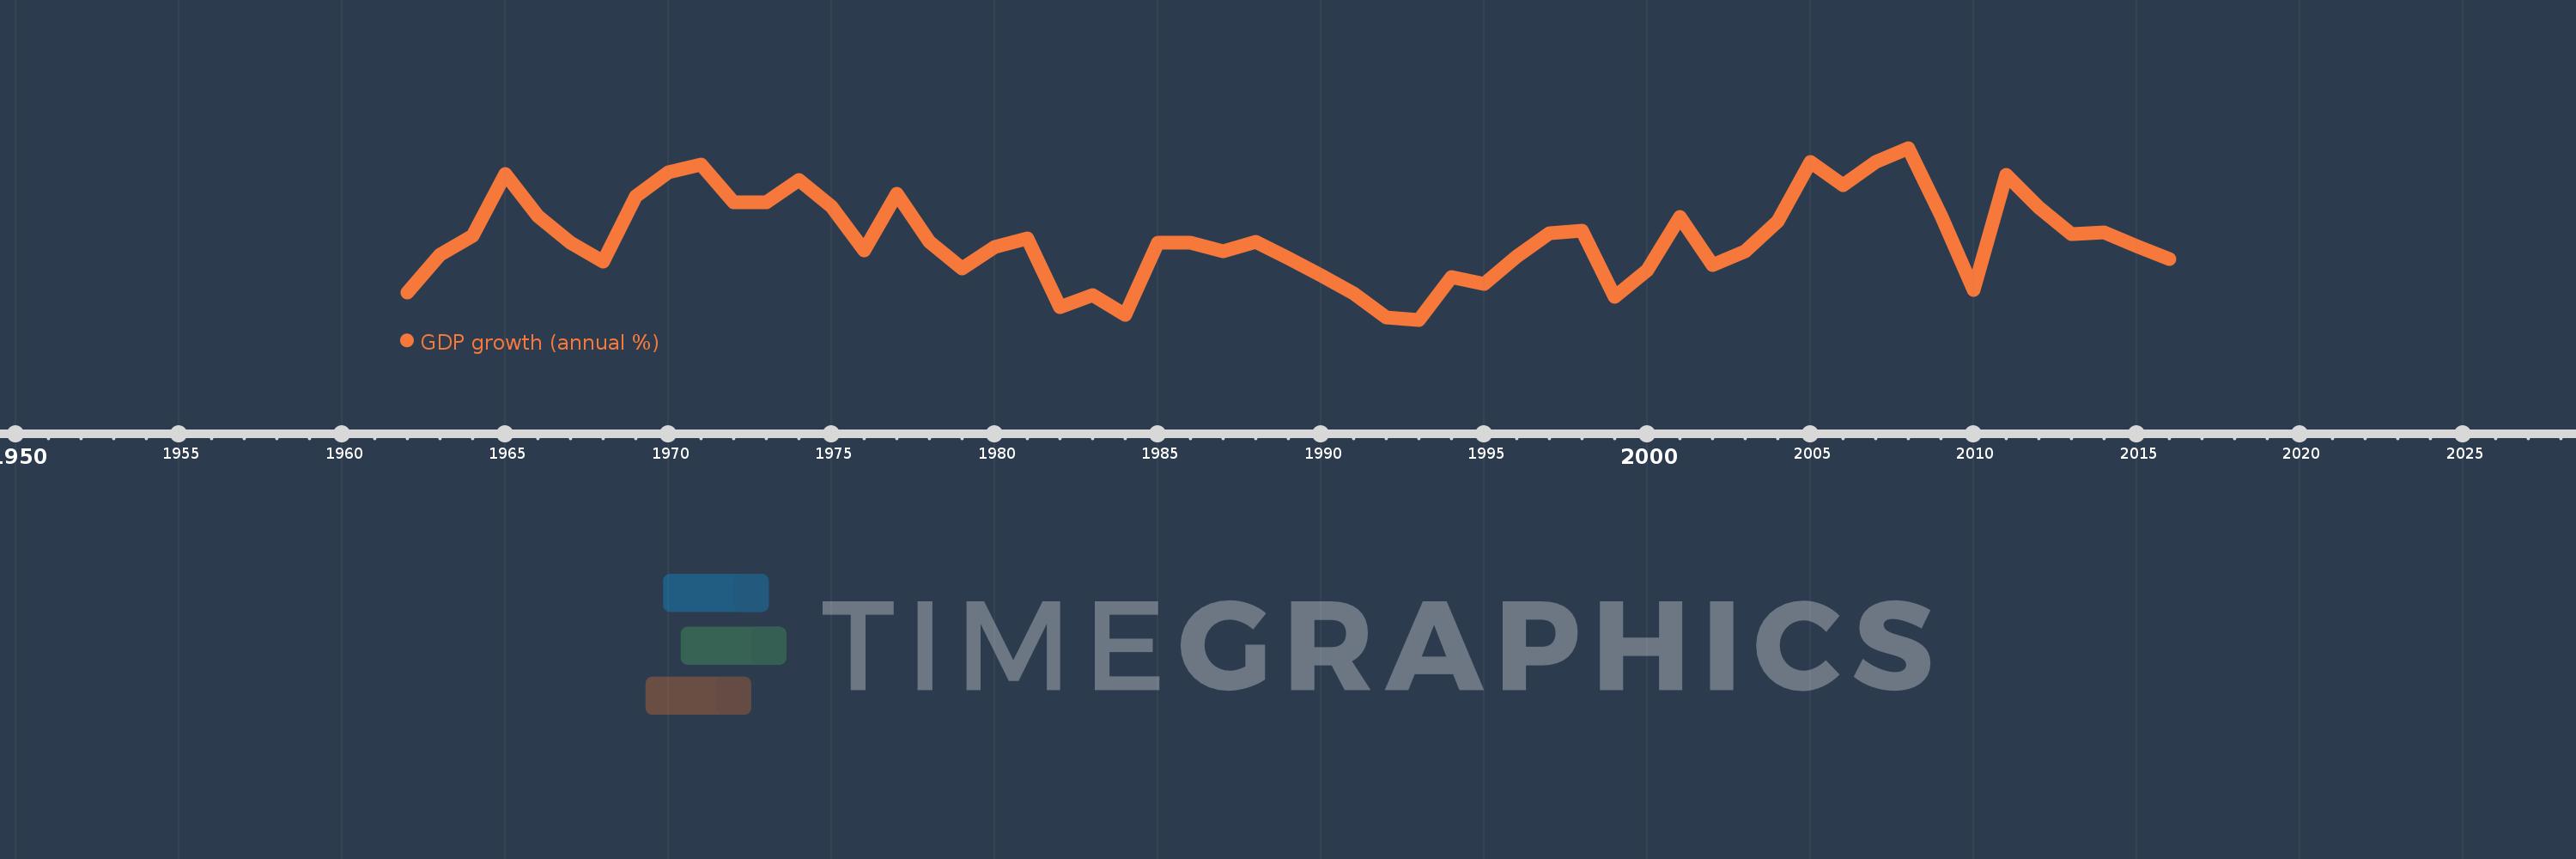
GDP growth (annual %)
2016,2015,2014,2013,2012,2011,2010,2009,2008,2007,2006,2005,2004,2003,2002,2001,2000,1999,1998,1997,1996,1995,1994,1993,1992,1991,1990,1989,1988,1987,1986,1985,1984,1983,1982,1981,1980,1979,1978,1977,1976,1975,1974,1973,1972,1971,1970,1969,1968,1967,1966,1965,1964,1963,1962
This statistics in other country:
AfghanistanAlbaniaAlgeriaAndorraAngolaAntigua and BarbudaArab WorldArgentinaArmeniaArubaAustraliaAustriaAzerbaijanBahamas, TheBahrainBangladeshBarbadosBelarusBelgiumBelizeBeninBermudaBhutanBoliviaBosnia and HerzegovinaBotswanaBrazilBrunei DarussalamBulgariaBurkina FasoBurundiCabo VerdeCambodiaCameroonCanadaCaribbean small statesCayman IslandsCentral African RepublicCentral Europe and the BalticsChadChannel IslandsChileChinaColombiaComorosCongo, Dem. Rep.Congo, Rep.Costa RicaCote d'IvoireCroatiaCubaCyprusCzech RepublicDenmarkDjiboutiDominicaDominican RepublicEarly-demographic dividendEast Asia & PacificEast Asia & Pacific (excluding high income)East Asia & Pacific (IDA & IBRD countries)EcuadorEgypt, Arab Rep.El SalvadorEquatorial GuineaEritreaEstoniaEthiopiaEuro areaEurope & Central AsiaEurope & Central Asia (excluding high income)Europe & Central Asia (IDA & IBRD countries)European UnionFijiFinlandFragile and conflict affected situationsFranceFrench PolynesiaGabonGambia, TheGeorgiaGermanyGhanaGreeceGreenlandGrenadaGuatemalaGuineaGuinea-BissauGuyanaHaitiHeavily indebted poor countries (HIPC)High incomeHondurasHong Kong SAR, ChinaHungaryIBRD onlyIcelandIDA & IBRD totalIDA blendIDA onlyIDA totalIndiaIndonesiaIran, Islamic Rep.IraqIrelandIsle of ManIsraelItalyJamaicaJapanJordanKazakhstanKenyaKiribatiKorea, Rep.KosovoKuwaitKyrgyz RepublicLao PDRLate-demographic dividendLatin America & Caribbean Latin America & Caribbean (excluding high income)Latin America & the Caribbean (IDA & IBRD countries)LatviaLeast developed countries: UN classificationLebanonLesothoLiberiaLibyaLiechtensteinLithuaniaLow & middle incomeLow incomeLower middle incomeLuxembourgMacao SAR, ChinaMacedonia, FYRMadagascarMalawiMalaysiaMaldivesMaliMaltaMarshall IslandsMauritaniaMauritiusMexicoMicronesia, Fed. Sts.Middle East & North AfricaMiddle East & North Africa (excluding high income)Middle East & North Africa (IDA & IBRD countries)Middle incomeMoldovaMonacoMongoliaMontenegroMoroccoMozambiqueMyanmarNamibiaNauruNepalNetherlandsNew CaledoniaNew ZealandNicaraguaNigerNigeriaNorth AmericaNorwayOECD membersOmanOther small statesPacific island small statesPakistanPalauPanamaPapua New GuineaParaguayPeruPhilippinesPolandPortugalPost-demographic dividendPre-demographic dividendPuerto RicoQatarRomaniaRussian FederationRwandaSamoaSan MarinoSao Tome and PrincipeSaudi ArabiaSenegalSerbiaSeychellesSierra LeoneSingaporeSlovak RepublicSloveniaSmall statesSolomon IslandsSomaliaSouth AfricaSouth AsiaSouth Asia (IDA & IBRD)South SudanSpainSri LankaSt. Kitts and NevisSt. LuciaSt. Vincent and the GrenadinesSub-Saharan Africa Sub-Saharan Africa (excluding high income)Sub-Saharan Africa (IDA & IBRD countries)SudanSurinameSwazilandSwedenSwitzerlandSyrian Arab RepublicTajikistanTanzaniaThailandTimor-LesteTogoTongaTrinidad and TobagoTunisiaTurkeyTurkmenistanTuvaluUgandaUkraineUnited Arab EmiratesUnited KingdomUnited StatesUpper middle incomeUruguayUzbekistanVanuatuVenezuela, RBVietnamVirgin Islands (U.S.)West Bank and GazaWorldYemen, Rep.ZambiaZimbabwe Timeline:
This timeline shows a graph from 1962 to 2016 of IDA & IBRD total. No data until 1961. Number of actual observations by date: 55.
Source name:
World Development Indicators
Source organization:
World Bank national accounts data, and OECD National Accounts data files.
Categories, topics:
Economy & Growth
Last updated:
apr 23, 2017
Indicators value changes by year
At the date of observation
Value
Absolute change
Change from previous value
jan 1, 1962
2.188
+2.188
0.0%
jan 1, 1963
3.873
+1.685
77.04%
jan 1, 1964
4.691
+0.818
21.11%
jan 1, 1965
7.439
+2.748
58.59%
jan 1, 1966
5.567
-1.872
-25.16%
jan 1, 1967
4.407
-1.161
-20.85%
jan 1, 1968
3.586
-0.821
-18.63%
jan 1, 1969
6.452
+2.866
79.93%
jan 1, 1970
7.535
+1.083
16.78%
jan 1, 1971
7.864
+0.328
4.36%
jan 1, 1972
6.203
-1.66
-21.11%
jan 1, 1973
6.176
-0.028
-0.45%
jan 1, 1974
7.162
+0.987
15.98%
jan 1, 1975
5.995
-1.167
-16.3%
jan 1, 1976
4.077
-1.918
-31.99%
jan 1, 1977
6.568
+2.491
61.11%
jan 1, 1978
4.455
-2.113
-32.18%
jan 1, 1979
3.28
-1.175
-26.37%
jan 1, 1980
4.228
+0.948
28.89%
jan 1, 1981
4.604
+0.376
8.89%
jan 1, 1982
1.558
-3.045
-66.15%
jan 1, 1983
2.098
+0.54
34.63%
jan 1, 1984
1.203
-0.895
-42.65%
jan 1, 1985
4.421
+3.218
267.53%
jan 1, 1986
4.411
-0.01
-0.24%
jan 1, 1987
4.009
-0.402
-9.11%
jan 1, 1988
4.436
+0.426
10.64%
jan 1, 1989
3.732
-0.704
-15.87%
jan 1, 1990
2.946
-0.786
-21.07%
jan 1, 1991
2.181
-0.764
-25.94%
jan 1, 1992
1.118
-1.064
-48.76%
jan 1, 1993
1.002
-0.116
-10.35%
jan 1, 1994
2.902
+1.9
189.58%
jan 1, 1995
2.576
-0.326
-11.24%
jan 1, 1996
3.783
+1.207
46.86%
jan 1, 1997
4.841
+1.059
27.99%
jan 1, 1998
4.951
+0.11
2.28%
jan 1, 1999
2.01
-2.942
-59.41%
jan 1, 2000
3.173
+1.163
57.89%
jan 1, 2001
5.54
+2.367
74.59%
jan 1, 2002
3.434
-2.106
-38.01%
jan 1, 2003
4.025
+0.591
17.2%
jan 1, 2004
5.368
+1.343
33.36%
jan 1, 2005
7.963
+2.595
48.34%
jan 1, 2006
6.966
-0.997
-12.52%
jan 1, 2007
7.982
+1.016
14.58%
jan 1, 2008
8.591
+0.609
7.63%
jan 1, 2009
5.63
-2.961
-34.47%
jan 1, 2010
2.305
-3.326
-59.07%
jan 1, 2011
7.415
+5.11
221.74%
jan 1, 2012
5.947
-1.468
-19.79%
jan 1, 2013
4.786
-1.161
-19.52%
jan 1, 2014
4.852
+0.066
1.37%
jan 1, 2015
4.246
-0.606
-12.49%
jan 1, 2016
3.688
-0.558
-13.13%
Ranking of countries by current statistics by years


Comments: