29
/
en
AIzaSyAYiBZKx7MnpbEhh9jyipgxe19OcubqV5w
April 1, 2024
79701
Barbados
BRB
true
2
1
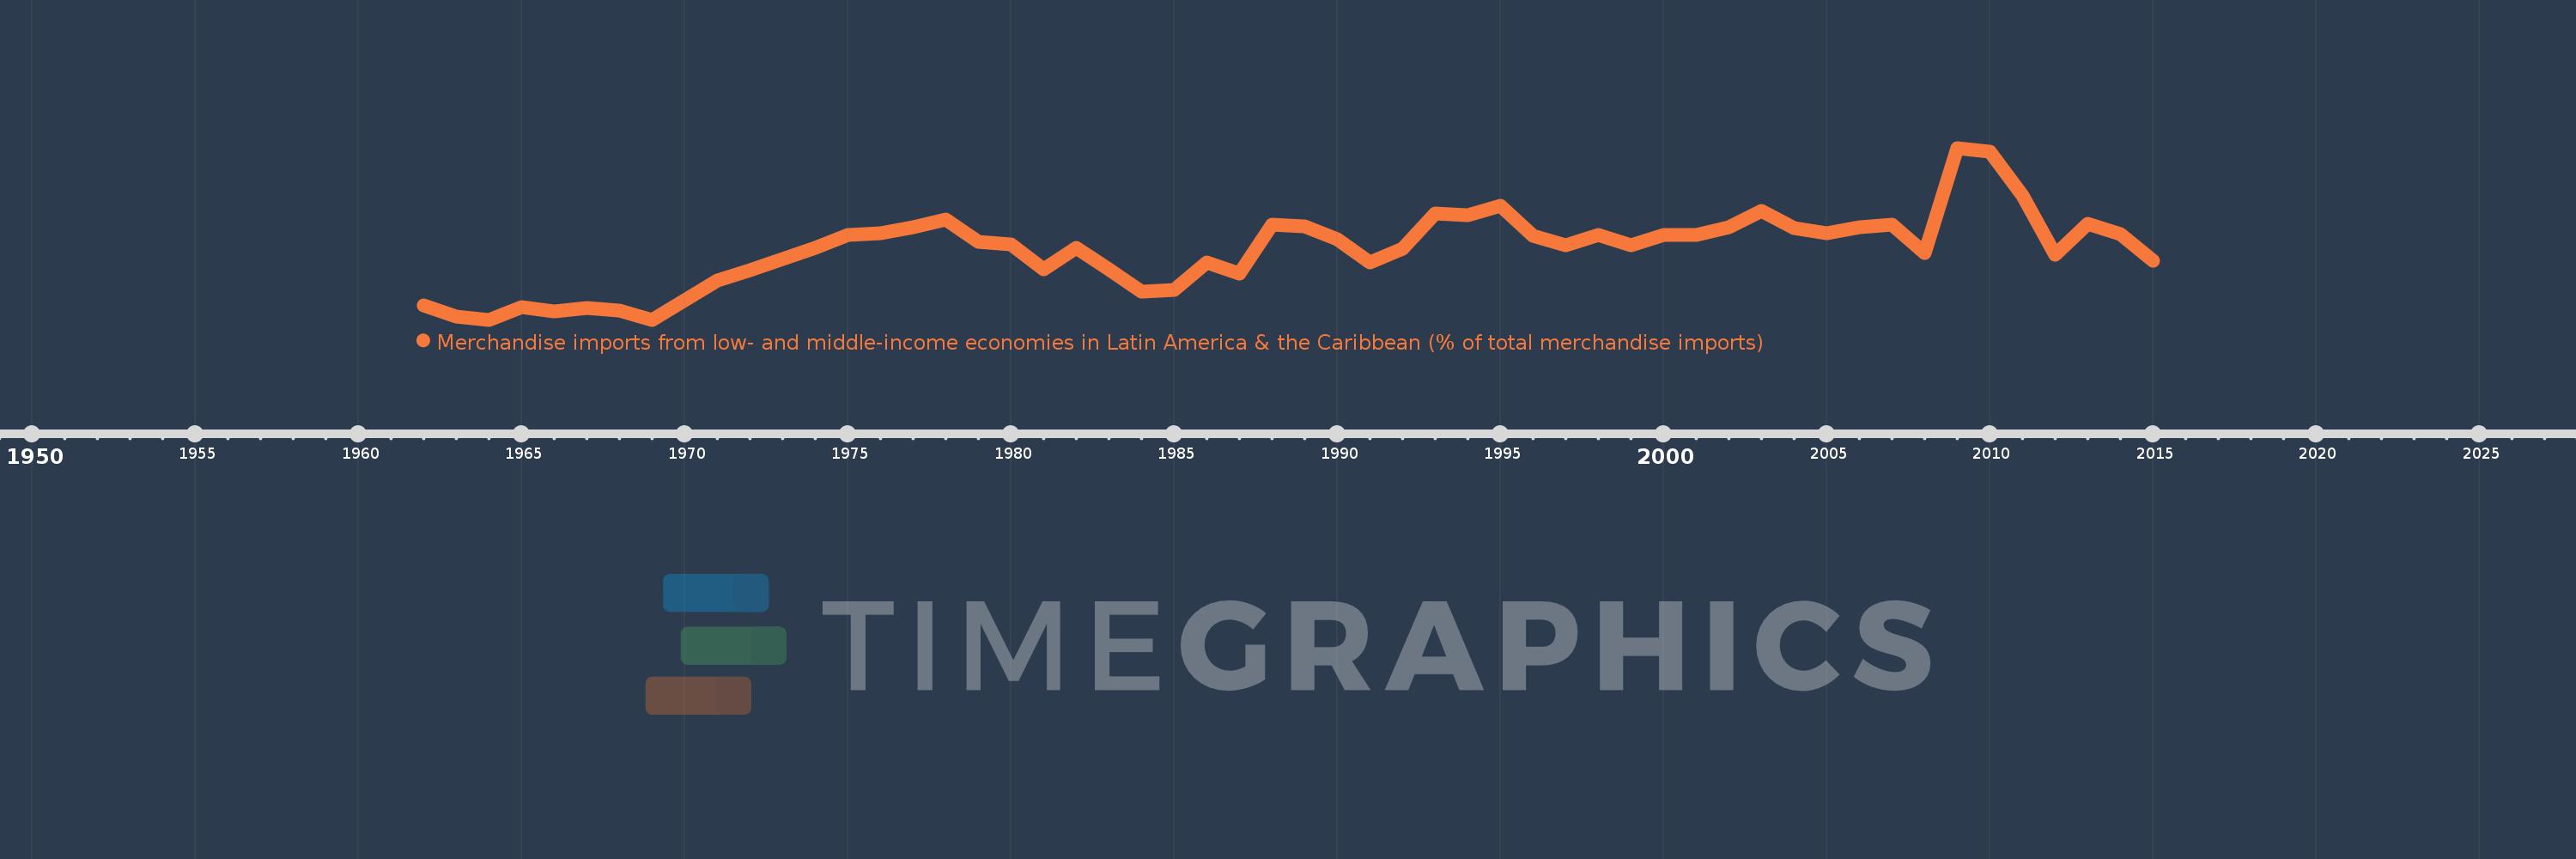
Merchandise imports from low- and middle-income economies in Latin America & the Caribbean (% of total merchandise imports)
2015,2014,2013,2012,2011,2010,2009,2008,2007,2006,2005,2004,2003,2002,2001,2000,1999,1998,1997,1996,1995,1994,1993,1992,1991,1990,1989,1988,1987,1986,1985,1984,1983,1982,1981,1980,1979,1978,1977,1976,1975,1974,1973,1972,1971,1969,1968,1967,1966,1965,1964,1963,1962
This statistics in other country:
AfghanistanAlbaniaAlgeriaAngolaAntigua and BarbudaArab WorldArgentinaArmeniaArubaAustraliaAustriaAzerbaijanBahamas, TheBahrainBangladeshBarbadosBelarusBelgiumBelizeBeninBermudaBoliviaBrazilBrunei DarussalamBulgariaBurkina FasoCabo VerdeCambodiaCameroonCanadaCaribbean small statesCentral African RepublicCentral Europe and the BalticsChileChinaColombiaCongo, Dem. Rep.Congo, Rep.Costa RicaCote d'IvoireCroatiaCubaCyprusCzech RepublicDenmarkDominicaDominican RepublicEarly-demographic dividendEast Asia & PacificEast Asia & Pacific (excluding high income)East Asia & Pacific (IDA & IBRD countries)EcuadorEgypt, Arab Rep.El SalvadorEstoniaEthiopiaEuro areaEurope & Central AsiaEurope & Central Asia (excluding high income)Europe & Central Asia (IDA & IBRD countries)European UnionFaroe IslandsFijiFinlandFragile and conflict affected situationsFranceFrench PolynesiaGabonGambia, TheGeorgiaGermanyGhanaGibraltarGreeceGreenlandGrenadaGuatemalaGuineaGuyanaHaitiHeavily indebted poor countries (HIPC)High incomeHondurasHong Kong SAR, ChinaHungaryIBRD onlyIcelandIDA & IBRD totalIDA blendIDA onlyIDA totalIndiaIndonesiaIran, Islamic Rep.IraqIrelandIsraelItalyJamaicaJapanJordanKazakhstanKenyaKorea, Dem. People’s Rep.Korea, Rep.KuwaitKyrgyz RepublicLate-demographic dividendLatin America & Caribbean Latin America & Caribbean (excluding high income)Latin America & the Caribbean (IDA & IBRD countries)LatviaLeast developed countries: UN classificationLebanonLiberiaLibyaLithuaniaLow & middle incomeLow incomeLower middle incomeLuxembourgMacao SAR, ChinaMacedonia, FYRMadagascarMalawiMalaysiaMaldivesMaliMaltaMauritaniaMauritiusMexicoMiddle East & North AfricaMiddle East & North Africa (excluding high income)Middle East & North Africa (IDA & IBRD countries)Middle incomeMoldovaMongoliaMontenegroMoroccoMozambiqueNetherlandsNew CaledoniaNew ZealandNicaraguaNigerNigeriaNorth AmericaNorwayOECD membersOmanOther small statesPacific island small statesPakistanPanamaPapua New GuineaParaguayPeruPhilippinesPolandPortugalPost-demographic dividendPre-demographic dividendQatarRomaniaRussian FederationSaudi ArabiaSenegalSerbiaSierra LeoneSingaporeSlovak RepublicSloveniaSmall statesSomaliaSouth AfricaSouth AsiaSouth Asia (IDA & IBRD)SpainSri LankaSt. Kitts and NevisSt. LuciaSt. Vincent and the GrenadinesSub-Saharan Africa Sub-Saharan Africa (excluding high income)Sub-Saharan Africa (IDA & IBRD countries)SudanSurinameSwedenSwitzerlandSyrian Arab RepublicTanzaniaThailandTogoTrinidad and TobagoTunisiaTurkeyUgandaUkraineUnited Arab EmiratesUnited KingdomUnited StatesUpper middle incomeUruguayVenezuela, RBVietnamWorldYemen, Rep.ZambiaZimbabwe Timeline:
This timeline shows a graph from 1962 to 2015 of Barbados. No data until 1961. Number of actual observations by date: 53.
Source name:
World Development Indicators
Source organization:
World Bank staff estimates based data from International Monetary Fund's Direction of Trade database.
Categories, topics:
Private Sector, Trade
Last updated:
apr 23, 2017
Indicators value changes by year
Maximum:
12.407
jan 1, 2009
At the date of observation
Value
Absolute change
Change from previous value
jan 1, 1962
3.913
+3.913
0.0%
jan 1, 1963
3.295
-0.618
-15.81%
jan 1, 1964
3.125
-0.17
-5.15%
jan 1, 1965
3.816
+0.691
22.1%
jan 1, 1966
3.593
-0.223
-5.84%
jan 1, 1967
3.771
+0.178
4.96%
jan 1, 1968
3.598
-0.173
-4.59%
jan 1, 1969
3.121
-0.477
-13.25%
jan 1, 1971
5.242
+2.12
67.93%
jan 1, 1972
5.789
+0.548
10.45%
jan 1, 1973
6.411
+0.622
10.74%
jan 1, 1974
6.985
+0.575
8.96%
jan 1, 1975
7.685
+0.7
10.01%
jan 1, 1976
7.809
+0.124
1.61%
jan 1, 1977
8.111
+0.302
3.87%
jan 1, 1978
8.519
+0.408
5.03%
jan 1, 1979
7.326
-1.192
-14.0%
jan 1, 1980
7.173
-0.154
-2.1%
jan 1, 1981
5.837
-1.335
-18.62%
jan 1, 1982
6.986
+1.149
19.68%
jan 1, 1983
5.83
-1.157
-16.56%
jan 1, 1984
4.622
-1.207
-20.71%
jan 1, 1985
4.728
+0.106
2.29%
jan 1, 1986
6.225
+1.497
31.66%
jan 1, 1987
5.631
-0.594
-9.54%
jan 1, 1988
8.24
+2.609
46.34%
jan 1, 1989
8.17
-0.07
-0.85%
jan 1, 1990
7.469
-0.702
-8.59%
jan 1, 1991
6.241
-1.227
-16.43%
jan 1, 1992
6.98
+0.739
11.84%
jan 1, 1993
8.851
+1.87
26.79%
jan 1, 1994
8.773
-0.078
-0.88%
jan 1, 1995
9.289
+0.516
5.88%
jan 1, 1996
7.67
-1.618
-17.42%
jan 1, 1997
7.125
-0.546
-7.12%
jan 1, 1998
7.687
+0.563
7.9%
jan 1, 1999
7.129
-0.558
-7.26%
jan 1, 2000
7.714
+0.585
8.21%
jan 1, 2001
7.722
+0.008
0.1%
jan 1, 2002
8.117
+0.394
5.11%
jan 1, 2003
8.993
+0.877
10.8%
jan 1, 2004
8.072
-0.921
-10.24%
jan 1, 2005
7.799
-0.274
-3.39%
jan 1, 2006
8.134
+0.336
4.31%
jan 1, 2007
8.264
+0.13
1.6%
jan 1, 2008
6.727
-1.537
-18.6%
jan 1, 2009
12.407
+5.679
84.42%
jan 1, 2010
12.214
-0.193
-1.56%
jan 1, 2011
9.843
-2.37
-19.41%
jan 1, 2012
6.655
-3.188
-32.39%
jan 1, 2013
8.29
+1.635
24.57%
jan 1, 2014
7.739
-0.551
-6.64%
jan 1, 2015
6.328
-1.411
-18.23%
Ranking of countries by current statistics by years


Comments: