29
/
en
AIzaSyAYiBZKx7MnpbEhh9jyipgxe19OcubqV5w
April 1, 2024
66292
Algeria
DZA
true
2
1
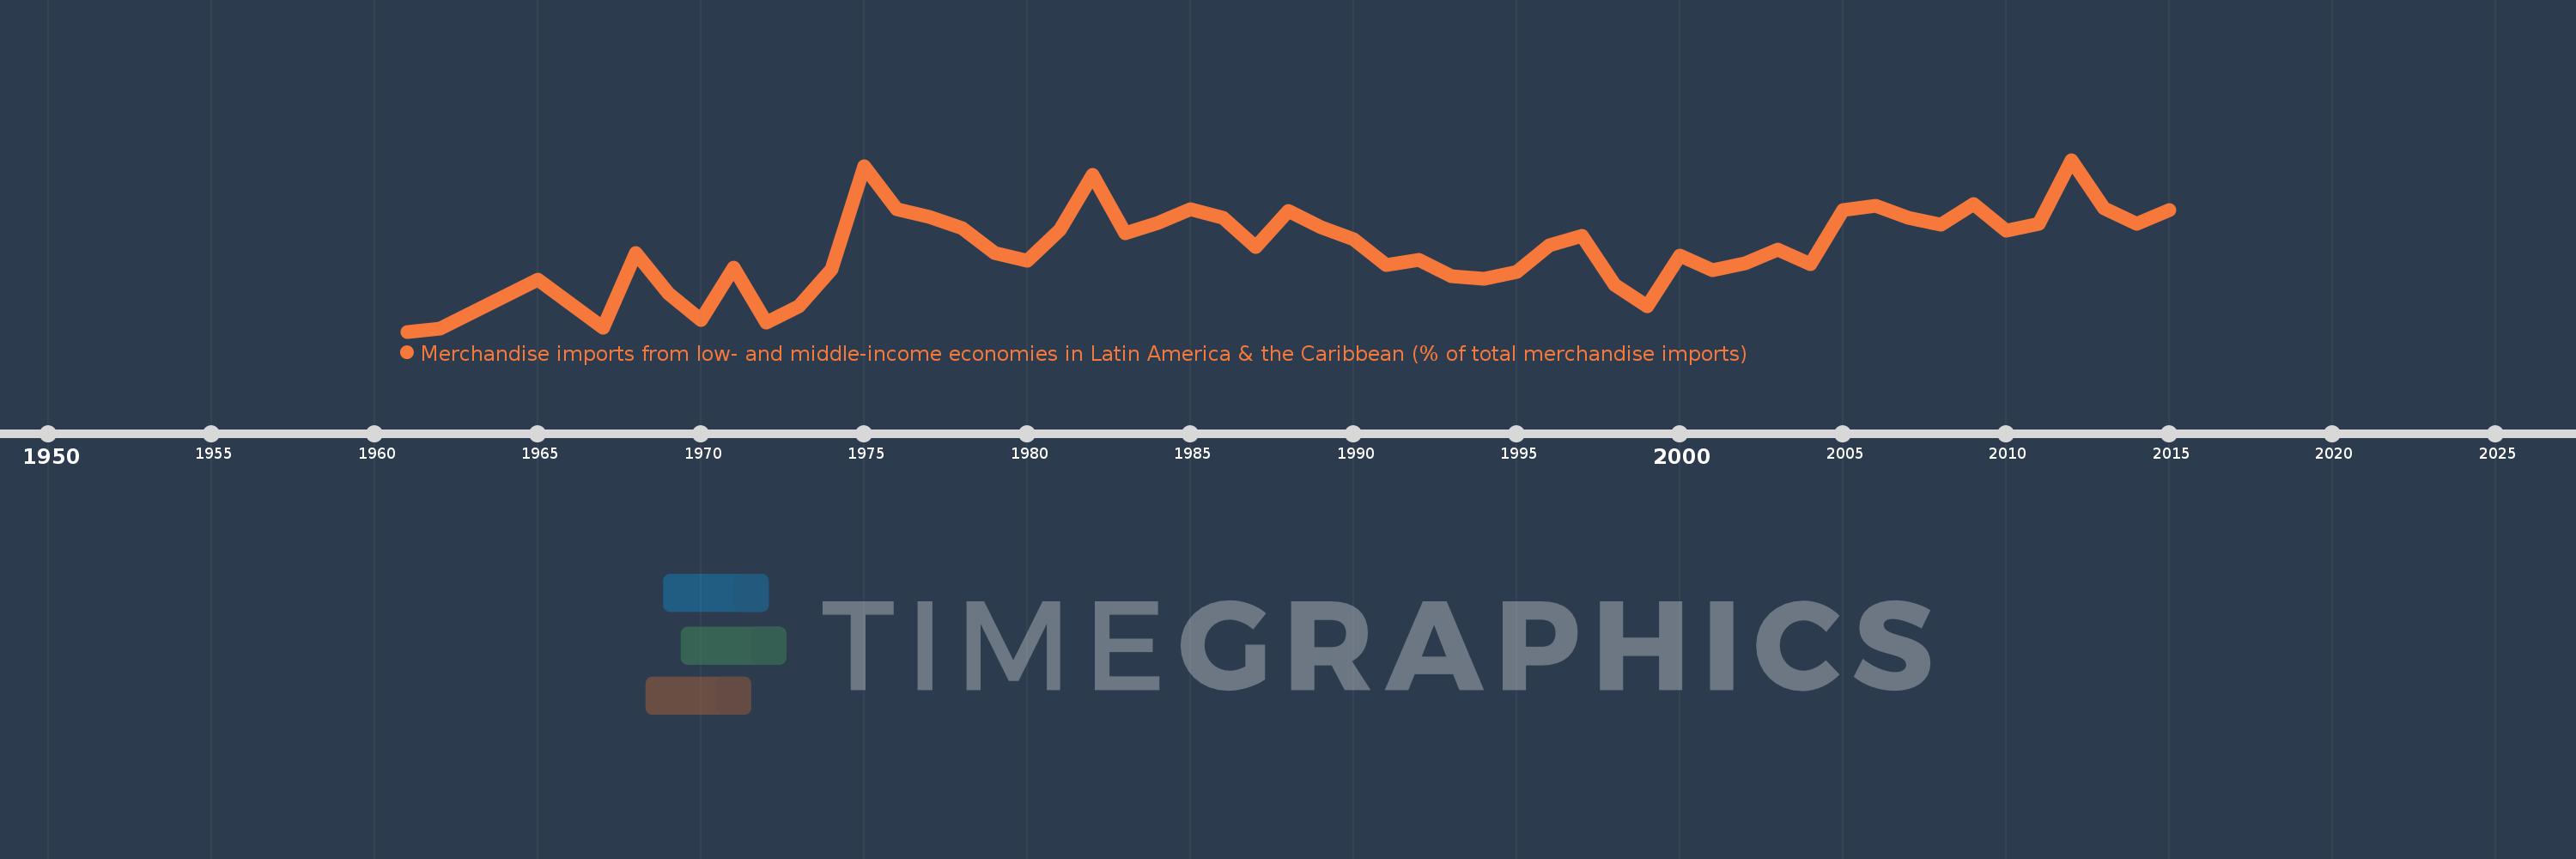
Merchandise imports from low- and middle-income economies in Latin America & the Caribbean (% of total merchandise imports)
2015,2014,2013,2012,2011,2010,2009,2008,2007,2006,2005,2004,2003,2002,2001,2000,1999,1998,1997,1996,1995,1994,1993,1992,1991,1990,1989,1988,1987,1986,1985,1984,1983,1982,1981,1980,1979,1978,1977,1976,1975,1974,1973,1972,1971,1970,1969,1968,1967,1965,1962,1961
This statistics in other country:
AfghanistanAlbaniaAlgeriaAngolaAntigua and BarbudaArab WorldArgentinaArmeniaArubaAustraliaAustriaAzerbaijanBahamas, TheBahrainBangladeshBarbadosBelarusBelgiumBelizeBeninBermudaBoliviaBrazilBrunei DarussalamBulgariaBurkina FasoCabo VerdeCambodiaCameroonCanadaCaribbean small statesCentral African RepublicCentral Europe and the BalticsChileChinaColombiaCongo, Dem. Rep.Congo, Rep.Costa RicaCote d'IvoireCroatiaCubaCyprusCzech RepublicDenmarkDominicaDominican RepublicEarly-demographic dividendEast Asia & PacificEast Asia & Pacific (excluding high income)East Asia & Pacific (IDA & IBRD countries)EcuadorEgypt, Arab Rep.El SalvadorEstoniaEthiopiaEuro areaEurope & Central AsiaEurope & Central Asia (excluding high income)Europe & Central Asia (IDA & IBRD countries)European UnionFaroe IslandsFijiFinlandFragile and conflict affected situationsFranceFrench PolynesiaGabonGambia, TheGeorgiaGermanyGhanaGibraltarGreeceGreenlandGrenadaGuatemalaGuineaGuyanaHaitiHeavily indebted poor countries (HIPC)High incomeHondurasHong Kong SAR, ChinaHungaryIBRD onlyIcelandIDA & IBRD totalIDA blendIDA onlyIDA totalIndiaIndonesiaIran, Islamic Rep.IraqIrelandIsraelItalyJamaicaJapanJordanKazakhstanKenyaKorea, Dem. People’s Rep.Korea, Rep.KuwaitKyrgyz RepublicLate-demographic dividendLatin America & Caribbean Latin America & Caribbean (excluding high income)Latin America & the Caribbean (IDA & IBRD countries)LatviaLeast developed countries: UN classificationLebanonLiberiaLibyaLithuaniaLow & middle incomeLow incomeLower middle incomeLuxembourgMacao SAR, ChinaMacedonia, FYRMadagascarMalawiMalaysiaMaldivesMaliMaltaMauritaniaMauritiusMexicoMiddle East & North AfricaMiddle East & North Africa (excluding high income)Middle East & North Africa (IDA & IBRD countries)Middle incomeMoldovaMongoliaMontenegroMoroccoMozambiqueNetherlandsNew CaledoniaNew ZealandNicaraguaNigerNigeriaNorth AmericaNorwayOECD membersOmanOther small statesPacific island small statesPakistanPanamaPapua New GuineaParaguayPeruPhilippinesPolandPortugalPost-demographic dividendPre-demographic dividendQatarRomaniaRussian FederationSaudi ArabiaSenegalSerbiaSierra LeoneSingaporeSlovak RepublicSloveniaSmall statesSomaliaSouth AfricaSouth AsiaSouth Asia (IDA & IBRD)SpainSri LankaSt. Kitts and NevisSt. LuciaSt. Vincent and the GrenadinesSub-Saharan Africa Sub-Saharan Africa (excluding high income)Sub-Saharan Africa (IDA & IBRD countries)SudanSurinameSwedenSwitzerlandSyrian Arab RepublicTanzaniaThailandTogoTrinidad and TobagoTunisiaTurkeyUgandaUkraineUnited Arab EmiratesUnited KingdomUnited StatesUpper middle incomeUruguayVenezuela, RBVietnamWorldYemen, Rep.ZambiaZimbabwe Timeline:
This timeline shows a graph from 1961 to 2015 of Algeria. No data until 1960. Number of actual observations by date: 52.
Source name:
World Development Indicators
Source organization:
World Bank staff estimates based data from International Monetary Fund's Direction of Trade database.
Categories, topics:
Private Sector, Trade
Last updated:
apr 23, 2017
Indicators value changes by year
At the date of observation
Value
Absolute change
Change from previous value
jan 1, 1961
0.294
+0.294
0.0%
jan 1, 1962
0.376
+0.082
28.05%
jan 1, 1965
1.712
+1.336
355.26%
jan 1, 1967
0.391
-1.32
-77.13%
jan 1, 1968
2.423
+2.032
519.0%
jan 1, 1969
1.338
-1.085
-44.79%
jan 1, 1970
0.613
-0.724
-54.14%
jan 1, 1971
2.044
+1.43
233.16%
jan 1, 1972
0.545
-1.499
-73.32%
jan 1, 1973
0.974
+0.429
78.64%
jan 1, 1974
1.987
+1.013
103.98%
jan 1, 1975
4.777
+2.79
140.41%
jan 1, 1976
3.62
-1.158
-24.23%
jan 1, 1977
3.41
-0.21
-5.81%
jan 1, 1978
3.117
-0.293
-8.59%
jan 1, 1979
2.421
-0.696
-22.33%
jan 1, 1980
2.21
-0.21
-8.69%
jan 1, 1981
3.057
+0.847
38.32%
jan 1, 1982
4.556
+1.499
49.02%
jan 1, 1983
2.972
-1.584
-34.77%
jan 1, 1984
3.248
+0.276
9.29%
jan 1, 1985
3.626
+0.378
11.64%
jan 1, 1986
3.389
-0.237
-6.55%
jan 1, 1987
2.59
-0.799
-23.58%
jan 1, 1988
3.568
+0.978
37.76%
jan 1, 1989
3.129
-0.439
-12.31%
jan 1, 1990
2.796
-0.333
-10.63%
jan 1, 1991
2.094
-0.702
-25.1%
jan 1, 1992
2.243
+0.149
7.09%
jan 1, 1993
1.808
-0.434
-19.36%
jan 1, 1994
1.736
-0.073
-4.02%
jan 1, 1995
1.925
+0.189
10.88%
jan 1, 1996
2.641
+0.716
37.22%
jan 1, 1997
2.887
+0.245
9.3%
jan 1, 1998
1.57
-1.317
-45.62%
jan 1, 1999
0.983
-0.587
-37.38%
jan 1, 2000
2.358
+1.375
139.88%
jan 1, 2001
1.969
-0.389
-16.52%
jan 1, 2002
2.149
+0.18
9.14%
jan 1, 2003
2.514
+0.366
17.02%
jan 1, 2004
2.126
-0.388
-15.45%
jan 1, 2005
3.586
+1.46
68.67%
jan 1, 2006
3.704
+0.118
3.29%
jan 1, 2007
3.394
-0.31
-8.38%
jan 1, 2008
3.212
-0.181
-5.34%
jan 1, 2009
3.764
+0.551
17.16%
jan 1, 2010
3.042
-0.722
-19.18%
jan 1, 2011
3.214
+0.172
5.66%
jan 1, 2012
4.963
+1.749
54.42%
jan 1, 2013
3.638
-1.325
-26.69%
jan 1, 2014
3.225
-0.413
-11.36%
jan 1, 2015
3.59
+0.365
11.32%
Ranking of countries by current statistics by years


Comments: