29
/
en
AIzaSyAYiBZKx7MnpbEhh9jyipgxe19OcubqV5w
April 1, 2024
57294
South Asia
SAS
false
2
1
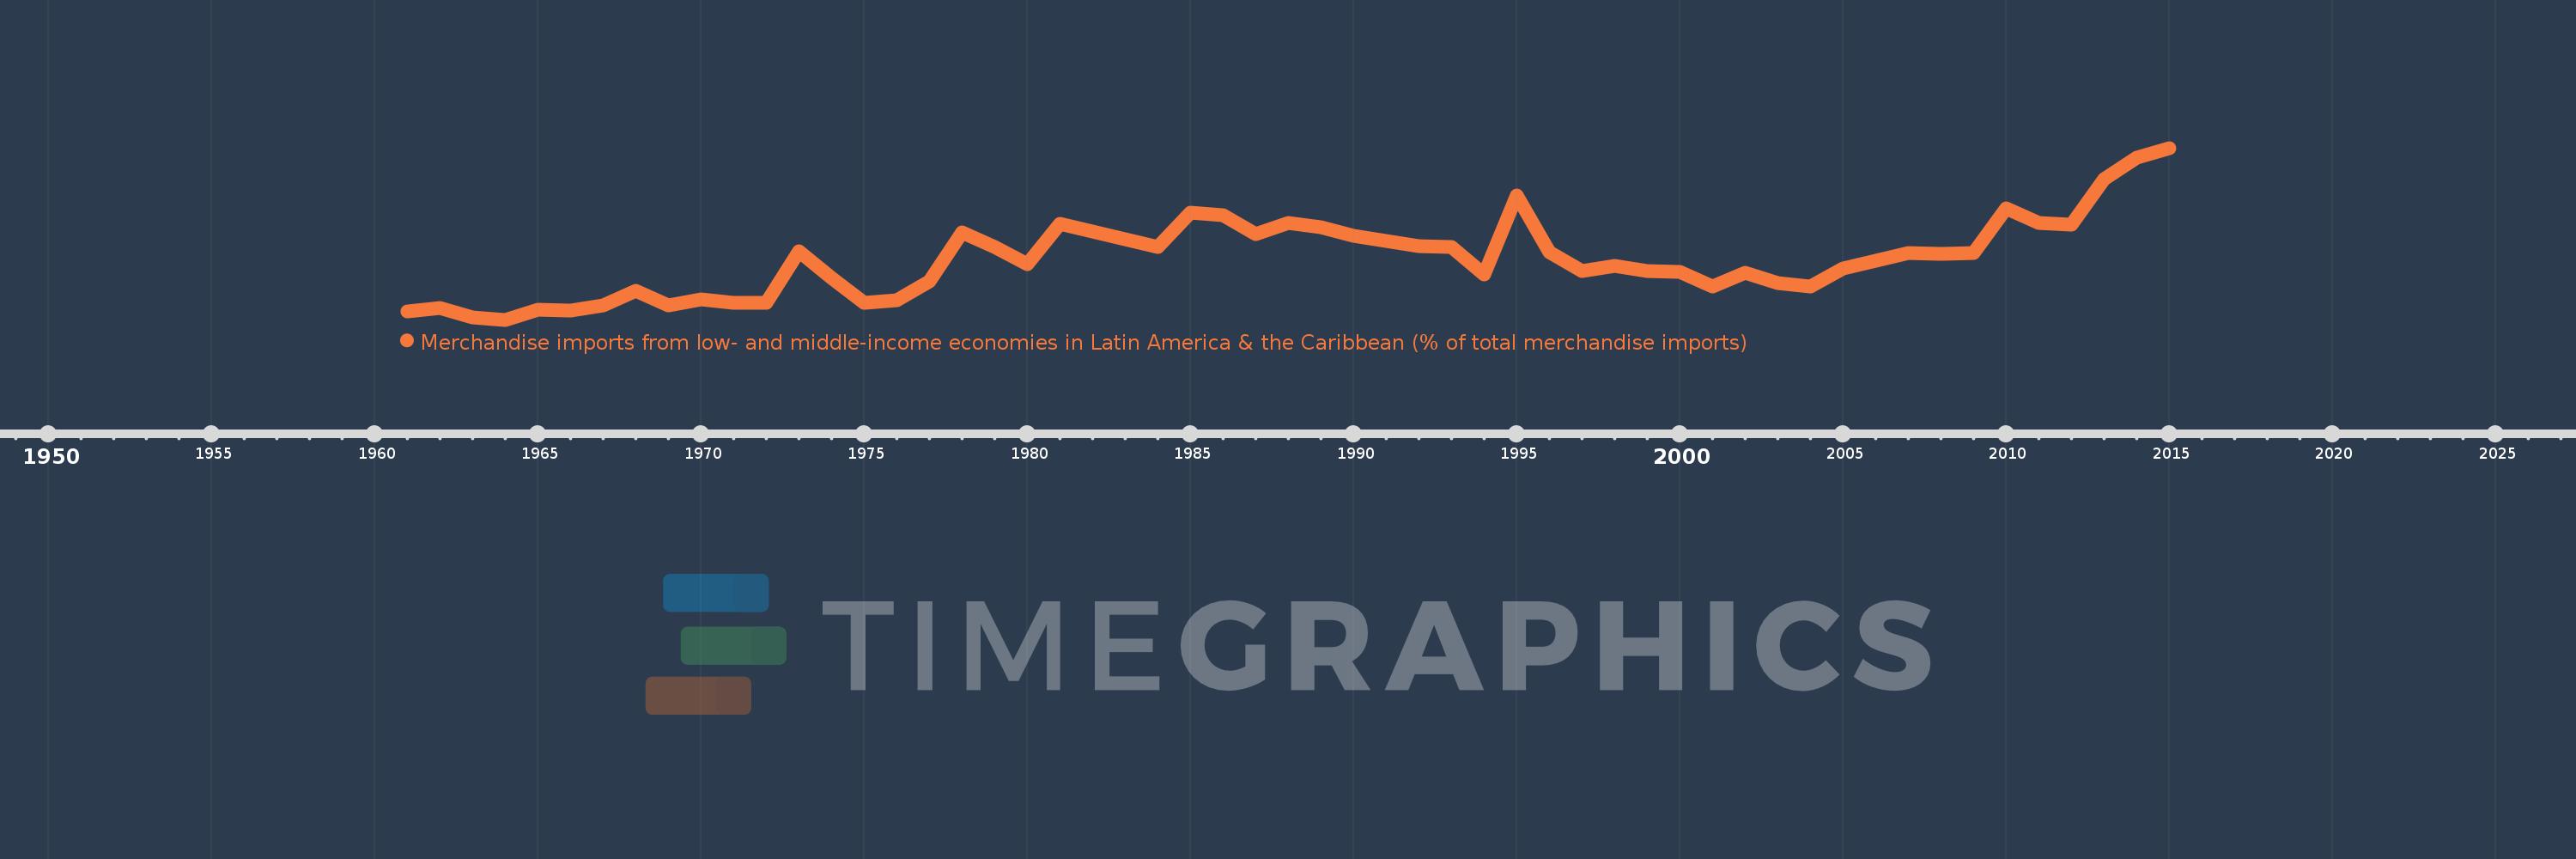
Merchandise imports from low- and middle-income economies in Latin America & the Caribbean (% of total merchandise imports)
2015,2014,2013,2012,2011,2010,2009,2008,2007,2006,2005,2004,2003,2002,2001,2000,1999,1998,1997,1996,1995,1994,1993,1992,1991,1990,1989,1988,1987,1986,1985,1984,1983,1982,1981,1980,1979,1978,1977,1976,1975,1974,1973,1972,1971,1970,1969,1968,1967,1966,1965,1964,1963,1962,1961
This statistics in other country:
AfghanistanAlbaniaAlgeriaAngolaAntigua and BarbudaArab WorldArgentinaArmeniaArubaAustraliaAustriaAzerbaijanBahamas, TheBahrainBangladeshBarbadosBelarusBelgiumBelizeBeninBermudaBoliviaBrazilBrunei DarussalamBulgariaBurkina FasoCabo VerdeCambodiaCameroonCanadaCaribbean small statesCentral African RepublicCentral Europe and the BalticsChileChinaColombiaCongo, Dem. Rep.Congo, Rep.Costa RicaCote d'IvoireCroatiaCubaCyprusCzech RepublicDenmarkDominicaDominican RepublicEarly-demographic dividendEast Asia & PacificEast Asia & Pacific (excluding high income)East Asia & Pacific (IDA & IBRD countries)EcuadorEgypt, Arab Rep.El SalvadorEstoniaEthiopiaEuro areaEurope & Central AsiaEurope & Central Asia (excluding high income)Europe & Central Asia (IDA & IBRD countries)European UnionFaroe IslandsFijiFinlandFragile and conflict affected situationsFranceFrench PolynesiaGabonGambia, TheGeorgiaGermanyGhanaGibraltarGreeceGreenlandGrenadaGuatemalaGuineaGuyanaHaitiHeavily indebted poor countries (HIPC)High incomeHondurasHong Kong SAR, ChinaHungaryIBRD onlyIcelandIDA & IBRD totalIDA blendIDA onlyIDA totalIndiaIndonesiaIran, Islamic Rep.IraqIrelandIsraelItalyJamaicaJapanJordanKazakhstanKenyaKorea, Dem. People’s Rep.Korea, Rep.KuwaitKyrgyz RepublicLate-demographic dividendLatin America & Caribbean Latin America & Caribbean (excluding high income)Latin America & the Caribbean (IDA & IBRD countries)LatviaLeast developed countries: UN classificationLebanonLiberiaLibyaLithuaniaLow & middle incomeLow incomeLower middle incomeLuxembourgMacao SAR, ChinaMacedonia, FYRMadagascarMalawiMalaysiaMaldivesMaliMaltaMauritaniaMauritiusMexicoMiddle East & North AfricaMiddle East & North Africa (excluding high income)Middle East & North Africa (IDA & IBRD countries)Middle incomeMoldovaMongoliaMontenegroMoroccoMozambiqueNetherlandsNew CaledoniaNew ZealandNicaraguaNigerNigeriaNorth AmericaNorwayOECD membersOmanOther small statesPacific island small statesPakistanPanamaPapua New GuineaParaguayPeruPhilippinesPolandPortugalPost-demographic dividendPre-demographic dividendQatarRomaniaRussian FederationSaudi ArabiaSenegalSerbiaSierra LeoneSingaporeSlovak RepublicSloveniaSmall statesSomaliaSouth AfricaSouth AsiaSouth Asia (IDA & IBRD)SpainSri LankaSt. Kitts and NevisSt. LuciaSt. Vincent and the GrenadinesSub-Saharan Africa Sub-Saharan Africa (excluding high income)Sub-Saharan Africa (IDA & IBRD countries)SudanSurinameSwedenSwitzerlandSyrian Arab RepublicTanzaniaThailandTogoTrinidad and TobagoTunisiaTurkeyUgandaUkraineUnited Arab EmiratesUnited KingdomUnited StatesUpper middle incomeUruguayVenezuela, RBVietnamWorldYemen, Rep.ZambiaZimbabwe Timeline:
This timeline shows a graph from 1961 to 2015 of South Asia. No data until 1960. Number of actual observations by date: 55.
Source name:
World Development Indicators
Source organization:
World Bank staff estimates based data from International Monetary Fund's Direction of Trade database.
Categories, topics:
Private Sector, Trade
Last updated:
apr 23, 2017
Indicators value changes by year
At the date of observation
Value
Absolute change
Change from previous value
jan 1, 1961
0.157
+0.157
0.0%
jan 1, 1962
0.216
+0.058
36.86%
jan 1, 1963
0.062
-0.154
-71.23%
jan 1, 1964
0.03
-0.032
-51.21%
jan 1, 1965
0.186
+0.156
514.25%
jan 1, 1966
0.177
-0.009
-4.93%
jan 1, 1967
0.251
+0.075
42.31%
jan 1, 1968
0.476
+0.224
89.14%
jan 1, 1969
0.247
-0.229
-48.12%
jan 1, 1970
0.347
+0.1
40.51%
jan 1, 1971
0.299
-0.048
-13.89%
jan 1, 1972
0.296
-0.002
-0.76%
jan 1, 1973
1.102
+0.806
271.9%
jan 1, 1974
0.685
-0.417
-37.85%
jan 1, 1975
0.293
-0.391
-57.15%
jan 1, 1976
0.33
+0.036
12.34%
jan 1, 1977
0.623
+0.293
88.99%
jan 1, 1978
1.386
+0.763
122.46%
jan 1, 1979
1.16
-0.226
-16.29%
jan 1, 1980
0.901
-0.259
-22.32%
jan 1, 1981
1.529
+0.627
69.62%
jan 1, 1982
1.412
-0.116
-7.61%
jan 1, 1983
1.283
-0.13
-9.18%
jan 1, 1984
1.16
-0.123
-9.6%
jan 1, 1985
1.7
+0.54
46.59%
jan 1, 1986
1.662
-0.038
-2.24%
jan 1, 1987
1.369
-0.293
-17.64%
jan 1, 1988
1.546
+0.178
12.99%
jan 1, 1989
1.468
-0.079
-5.09%
jan 1, 1990
1.345
-0.123
-8.38%
jan 1, 1991
1.264
-0.08
-5.97%
jan 1, 1992
1.179
-0.086
-6.78%
jan 1, 1993
1.158
-0.021
-1.78%
jan 1, 1994
0.736
-0.422
-36.45%
jan 1, 1995
1.968
+1.232
167.49%
jan 1, 1996
1.082
-0.886
-45.03%
jan 1, 1997
0.794
-0.288
-26.63%
jan 1, 1998
0.865
+0.071
9.0%
jan 1, 1999
0.787
-0.078
-9.03%
jan 1, 2000
0.775
-0.012
-1.55%
jan 1, 2001
0.548
-0.226
-29.23%
jan 1, 2002
0.761
+0.213
38.84%
jan 1, 2003
0.607
-0.154
-20.2%
jan 1, 2004
0.542
-0.066
-10.81%
jan 1, 2005
0.827
+0.286
52.73%
jan 1, 2006
0.954
+0.126
15.27%
jan 1, 2007
1.069
+0.115
12.09%
jan 1, 2008
1.064
-0.006
-0.52%
jan 1, 2009
1.065
+0.001
0.13%
jan 1, 2010
1.761
+0.696
65.32%
jan 1, 2011
1.541
-0.22
-12.48%
jan 1, 2012
1.517
-0.024
-1.55%
jan 1, 2013
2.221
+0.704
46.44%
jan 1, 2014
2.551
+0.329
14.82%
jan 1, 2015
2.709
+0.158
6.2%
Ranking of countries by current statistics by years


Comments: