29
/
en
AIzaSyAYiBZKx7MnpbEhh9jyipgxe19OcubqV5w
April 1, 2024
125092
Egypt, Arab Rep.
EGY
true
2
1
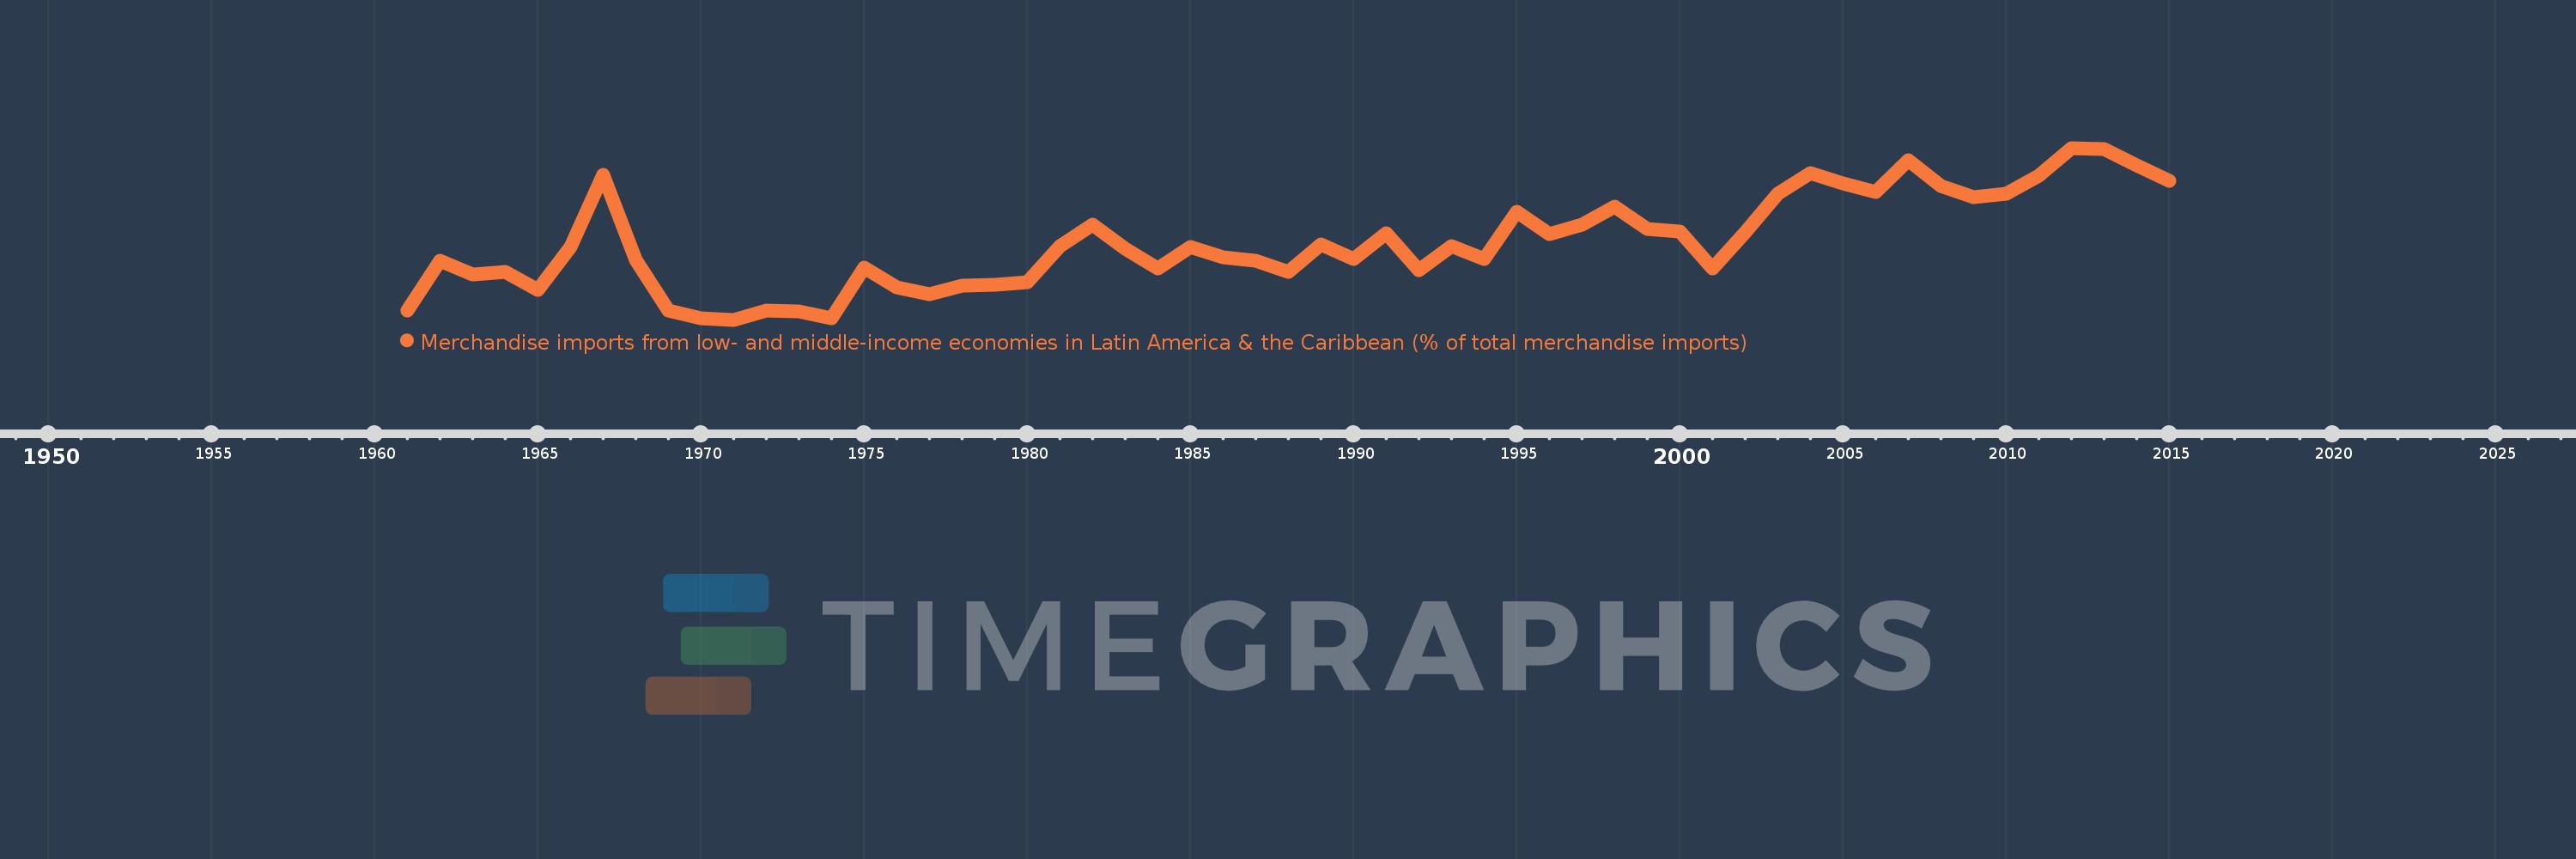
Merchandise imports from low- and middle-income economies in Latin America & the Caribbean (% of total merchandise imports)
2015,2014,2013,2012,2011,2010,2009,2008,2007,2006,2005,2004,2003,2002,2001,2000,1999,1998,1997,1996,1995,1994,1993,1992,1991,1990,1989,1988,1987,1986,1985,1984,1983,1982,1981,1980,1979,1978,1977,1976,1975,1974,1973,1972,1971,1970,1969,1968,1967,1966,1965,1964,1963,1962,1961
This statistics in other country:
AfghanistanAlbaniaAlgeriaAngolaAntigua and BarbudaArab WorldArgentinaArmeniaArubaAustraliaAustriaAzerbaijanBahamas, TheBahrainBangladeshBarbadosBelarusBelgiumBelizeBeninBermudaBoliviaBrazilBrunei DarussalamBulgariaBurkina FasoCabo VerdeCambodiaCameroonCanadaCaribbean small statesCentral African RepublicCentral Europe and the BalticsChileChinaColombiaCongo, Dem. Rep.Congo, Rep.Costa RicaCote d'IvoireCroatiaCubaCyprusCzech RepublicDenmarkDominicaDominican RepublicEarly-demographic dividendEast Asia & PacificEast Asia & Pacific (excluding high income)East Asia & Pacific (IDA & IBRD countries)EcuadorEgypt, Arab Rep.El SalvadorEstoniaEthiopiaEuro areaEurope & Central AsiaEurope & Central Asia (excluding high income)Europe & Central Asia (IDA & IBRD countries)European UnionFaroe IslandsFijiFinlandFragile and conflict affected situationsFranceFrench PolynesiaGabonGambia, TheGeorgiaGermanyGhanaGibraltarGreeceGreenlandGrenadaGuatemalaGuineaGuyanaHaitiHeavily indebted poor countries (HIPC)High incomeHondurasHong Kong SAR, ChinaHungaryIBRD onlyIcelandIDA & IBRD totalIDA blendIDA onlyIDA totalIndiaIndonesiaIran, Islamic Rep.IraqIrelandIsraelItalyJamaicaJapanJordanKazakhstanKenyaKorea, Dem. People’s Rep.Korea, Rep.KuwaitKyrgyz RepublicLate-demographic dividendLatin America & Caribbean Latin America & Caribbean (excluding high income)Latin America & the Caribbean (IDA & IBRD countries)LatviaLeast developed countries: UN classificationLebanonLiberiaLibyaLithuaniaLow & middle incomeLow incomeLower middle incomeLuxembourgMacao SAR, ChinaMacedonia, FYRMadagascarMalawiMalaysiaMaldivesMaliMaltaMauritaniaMauritiusMexicoMiddle East & North AfricaMiddle East & North Africa (excluding high income)Middle East & North Africa (IDA & IBRD countries)Middle incomeMoldovaMongoliaMontenegroMoroccoMozambiqueNetherlandsNew CaledoniaNew ZealandNicaraguaNigerNigeriaNorth AmericaNorwayOECD membersOmanOther small statesPacific island small statesPakistanPanamaPapua New GuineaParaguayPeruPhilippinesPolandPortugalPost-demographic dividendPre-demographic dividendQatarRomaniaRussian FederationSaudi ArabiaSenegalSerbiaSierra LeoneSingaporeSlovak RepublicSloveniaSmall statesSomaliaSouth AfricaSouth AsiaSouth Asia (IDA & IBRD)SpainSri LankaSt. Kitts and NevisSt. LuciaSt. Vincent and the GrenadinesSub-Saharan Africa Sub-Saharan Africa (excluding high income)Sub-Saharan Africa (IDA & IBRD countries)SudanSurinameSwedenSwitzerlandSyrian Arab RepublicTanzaniaThailandTogoTrinidad and TobagoTunisiaTurkeyUgandaUkraineUnited Arab EmiratesUnited KingdomUnited StatesUpper middle incomeUruguayVenezuela, RBVietnamWorldYemen, Rep.ZambiaZimbabwe Timeline:
This timeline shows a graph from 1961 to 2015 of Egypt, Arab Rep.. No data until 1960. Number of actual observations by date: 55.
Source name:
World Development Indicators
Source organization:
World Bank staff estimates based data from International Monetary Fund's Direction of Trade database.
Categories, topics:
Private Sector, Trade
Last updated:
apr 23, 2017
Indicators value changes by year
At the date of observation
Value
Absolute change
Change from previous value
jan 1, 1961
0.286
+0.286
0.0%
jan 1, 1962
1.474
+1.187
414.97%
jan 1, 1963
1.146
-0.327
-22.22%
jan 1, 1964
1.2
+0.054
4.75%
jan 1, 1965
0.776
-0.424
-35.32%
jan 1, 1966
1.811
+1.034
133.22%
jan 1, 1967
3.524
+1.713
94.6%
jan 1, 1968
1.491
-2.032
-57.68%
jan 1, 1969
0.274
-1.217
-81.64%
jan 1, 1970
0.102
-0.172
-62.8%
jan 1, 1971
0.057
-0.045
-43.93%
jan 1, 1972
0.282
+0.224
393.04%
jan 1, 1973
0.26
-0.022
-7.69%
jan 1, 1974
0.085
-0.175
-67.38%
jan 1, 1975
1.301
+1.216
1.43K%
jan 1, 1976
0.836
-0.465
-35.72%
jan 1, 1977
0.67
-0.166
-19.9%
jan 1, 1978
0.872
+0.202
30.21%
jan 1, 1979
0.888
+0.016
1.83%
jan 1, 1980
0.948
+0.06
6.73%
jan 1, 1981
1.825
+0.877
92.44%
jan 1, 1982
2.347
+0.522
28.61%
jan 1, 1983
1.756
-0.591
-25.17%
jan 1, 1984
1.296
-0.46
-26.18%
jan 1, 1985
1.805
+0.509
39.23%
jan 1, 1986
1.561
-0.244
-13.51%
jan 1, 1987
1.477
-0.084
-5.38%
jan 1, 1988
1.212
-0.265
-17.94%
jan 1, 1989
1.855
+0.643
53.07%
jan 1, 1990
1.505
-0.35
-18.86%
jan 1, 1991
2.132
+0.626
41.61%
jan 1, 1992
1.241
-0.891
-41.79%
jan 1, 1993
1.822
+0.581
46.85%
jan 1, 1994
1.517
-0.306
-16.78%
jan 1, 1995
2.641
+1.124
74.14%
jan 1, 1996
2.113
-0.528
-20.01%
jan 1, 1997
2.34
+0.227
10.75%
jan 1, 1998
2.768
+0.428
18.29%
jan 1, 1999
2.235
-0.533
-19.24%
jan 1, 2000
2.182
-0.053
-2.38%
jan 1, 2001
1.288
-0.894
-40.98%
jan 1, 2002
2.15
+0.863
66.97%
jan 1, 2003
3.068
+0.917
42.66%
jan 1, 2004
3.577
+0.509
16.6%
jan 1, 2005
3.333
-0.244
-6.82%
jan 1, 2006
3.128
-0.205
-6.15%
jan 1, 2007
3.879
+0.752
24.03%
jan 1, 2008
3.271
-0.609
-15.69%
jan 1, 2009
3.003
-0.268
-8.19%
jan 1, 2010
3.077
+0.074
2.47%
jan 1, 2011
3.503
+0.425
13.83%
jan 1, 2012
4.176
+0.674
19.23%
jan 1, 2013
4.142
-0.034
-0.82%
jan 1, 2014
3.753
-0.389
-9.39%
jan 1, 2015
3.385
-0.368
-9.81%
Ranking of countries by current statistics by years


Comments: