29
/
en
AIzaSyAYiBZKx7MnpbEhh9jyipgxe19OcubqV5w
April 1, 2024
287492
Zimbabwe
ZWE
true
2
1
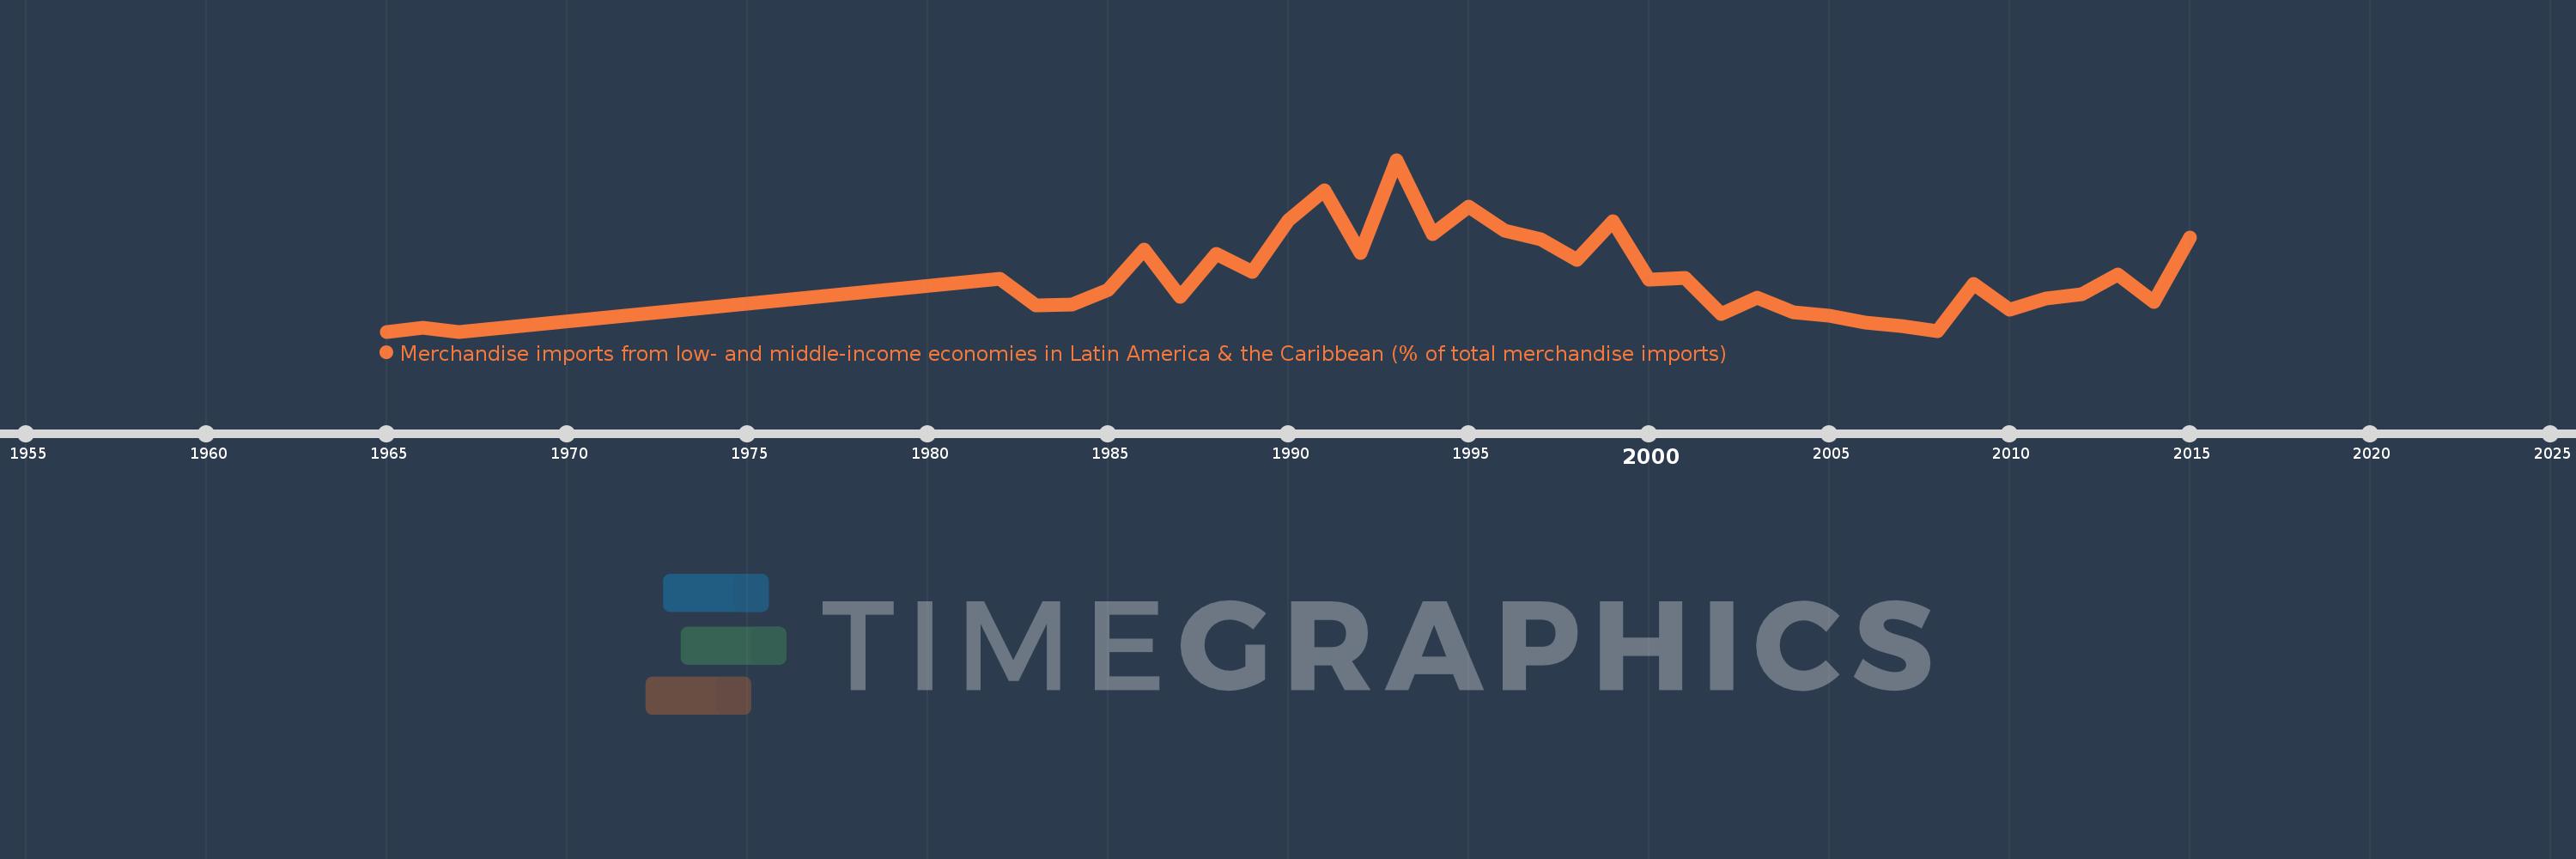
Merchandise imports from low- and middle-income economies in Latin America & the Caribbean (% of total merchandise imports)
2015,2014,2013,2012,2011,2010,2009,2008,2007,2006,2005,2004,2003,2002,2001,2000,1999,1998,1997,1996,1995,1994,1993,1992,1991,1990,1989,1988,1987,1986,1985,1984,1983,1982,1967,1966,1965
This statistics in other country:
AfghanistanAlbaniaAlgeriaAngolaAntigua and BarbudaArab WorldArgentinaArmeniaArubaAustraliaAustriaAzerbaijanBahamas, TheBahrainBangladeshBarbadosBelarusBelgiumBelizeBeninBermudaBoliviaBrazilBrunei DarussalamBulgariaBurkina FasoCabo VerdeCambodiaCameroonCanadaCaribbean small statesCentral African RepublicCentral Europe and the BalticsChileChinaColombiaCongo, Dem. Rep.Congo, Rep.Costa RicaCote d'IvoireCroatiaCubaCyprusCzech RepublicDenmarkDominicaDominican RepublicEarly-demographic dividendEast Asia & PacificEast Asia & Pacific (excluding high income)East Asia & Pacific (IDA & IBRD countries)EcuadorEgypt, Arab Rep.El SalvadorEstoniaEthiopiaEuro areaEurope & Central AsiaEurope & Central Asia (excluding high income)Europe & Central Asia (IDA & IBRD countries)European UnionFaroe IslandsFijiFinlandFragile and conflict affected situationsFranceFrench PolynesiaGabonGambia, TheGeorgiaGermanyGhanaGibraltarGreeceGreenlandGrenadaGuatemalaGuineaGuyanaHaitiHeavily indebted poor countries (HIPC)High incomeHondurasHong Kong SAR, ChinaHungaryIBRD onlyIcelandIDA & IBRD totalIDA blendIDA onlyIDA totalIndiaIndonesiaIran, Islamic Rep.IraqIrelandIsraelItalyJamaicaJapanJordanKazakhstanKenyaKorea, Dem. People’s Rep.Korea, Rep.KuwaitKyrgyz RepublicLate-demographic dividendLatin America & Caribbean Latin America & Caribbean (excluding high income)Latin America & the Caribbean (IDA & IBRD countries)LatviaLeast developed countries: UN classificationLebanonLiberiaLibyaLithuaniaLow & middle incomeLow incomeLower middle incomeLuxembourgMacao SAR, ChinaMacedonia, FYRMadagascarMalawiMalaysiaMaldivesMaliMaltaMauritaniaMauritiusMexicoMiddle East & North AfricaMiddle East & North Africa (excluding high income)Middle East & North Africa (IDA & IBRD countries)Middle incomeMoldovaMongoliaMontenegroMoroccoMozambiqueNetherlandsNew CaledoniaNew ZealandNicaraguaNigerNigeriaNorth AmericaNorwayOECD membersOmanOther small statesPacific island small statesPakistanPanamaPapua New GuineaParaguayPeruPhilippinesPolandPortugalPost-demographic dividendPre-demographic dividendQatarRomaniaRussian FederationSaudi ArabiaSenegalSerbiaSierra LeoneSingaporeSlovak RepublicSloveniaSmall statesSomaliaSouth AfricaSouth AsiaSouth Asia (IDA & IBRD)SpainSri LankaSt. Kitts and NevisSt. LuciaSt. Vincent and the GrenadinesSub-Saharan Africa Sub-Saharan Africa (excluding high income)Sub-Saharan Africa (IDA & IBRD countries)SudanSurinameSwedenSwitzerlandSyrian Arab RepublicTanzaniaThailandTogoTrinidad and TobagoTunisiaTurkeyUgandaUkraineUnited Arab EmiratesUnited KingdomUnited StatesUpper middle incomeUruguayVenezuela, RBVietnamWorldYemen, Rep.ZambiaZimbabwe Timeline:
This timeline shows a graph from 1965 to 2015 of Zimbabwe. No data until 1964. Number of actual observations by date: 37.
Source name:
World Development Indicators
Source organization:
World Bank staff estimates based data from International Monetary Fund's Direction of Trade database.
Categories, topics:
Private Sector, Trade
Last updated:
apr 23, 2017
Indicators value changes by year
At the date of observation
Value
Absolute change
Change from previous value
jan 1, 1967
0.0
-0.03
-100.0%
jan 1, 1982
0.437
+0.437
%
jan 1, 1983
0.214
-0.224
-51.13%
jan 1, 1984
0.22
+0.007
3.04%
jan 1, 1985
0.343
+0.123
55.87%
jan 1, 1986
0.678
+0.335
97.64%
jan 1, 1987
0.285
-0.393
-57.99%
jan 1, 1988
0.644
+0.359
126.11%
jan 1, 1989
0.49
-0.154
-23.96%
jan 1, 1990
0.915
+0.425
86.72%
jan 1, 1991
1.164
+0.25
27.29%
jan 1, 1992
0.65
-0.515
-44.21%
jan 1, 1993
1.418
+0.768
118.24%
jan 1, 1994
0.806
-0.611
-43.12%
jan 1, 1995
1.032
+0.226
28.05%
jan 1, 1996
0.835
-0.198
-19.17%
jan 1, 1997
0.759
-0.075
-9.0%
jan 1, 1998
0.594
-0.166
-21.84%
jan 1, 1999
0.913
+0.32
53.88%
jan 1, 2000
0.426
-0.488
-53.39%
jan 1, 2001
0.444
+0.019
4.38%
jan 1, 2002
0.144
-0.301
-67.68%
jan 1, 2003
0.277
+0.134
93.2%
jan 1, 2004
0.159
-0.118
-42.63%
jan 1, 2005
0.129
-0.03
-18.68%
jan 1, 2006
0.075
-0.055
-42.22%
jan 1, 2007
0.047
-0.028
-37.27%
jan 1, 2008
0.001
-0.046
-97.12%
jan 1, 2009
0.391
+0.389
28.85K%
jan 1, 2010
0.182
-0.209
-53.44%
jan 1, 2011
0.274
+0.092
50.65%
jan 1, 2012
0.305
+0.03
11.11%
jan 1, 2013
0.469
+0.165
54.17%
jan 1, 2014
0.248
-0.222
-47.22%
jan 1, 2015
0.779
+0.531
214.28%
Ranking of countries by current statistics by years


Comments: