29
/
en
AIzaSyAYiBZKx7MnpbEhh9jyipgxe19OcubqV5w
April 1, 2024
247818
Spain
ESP
true
2
1
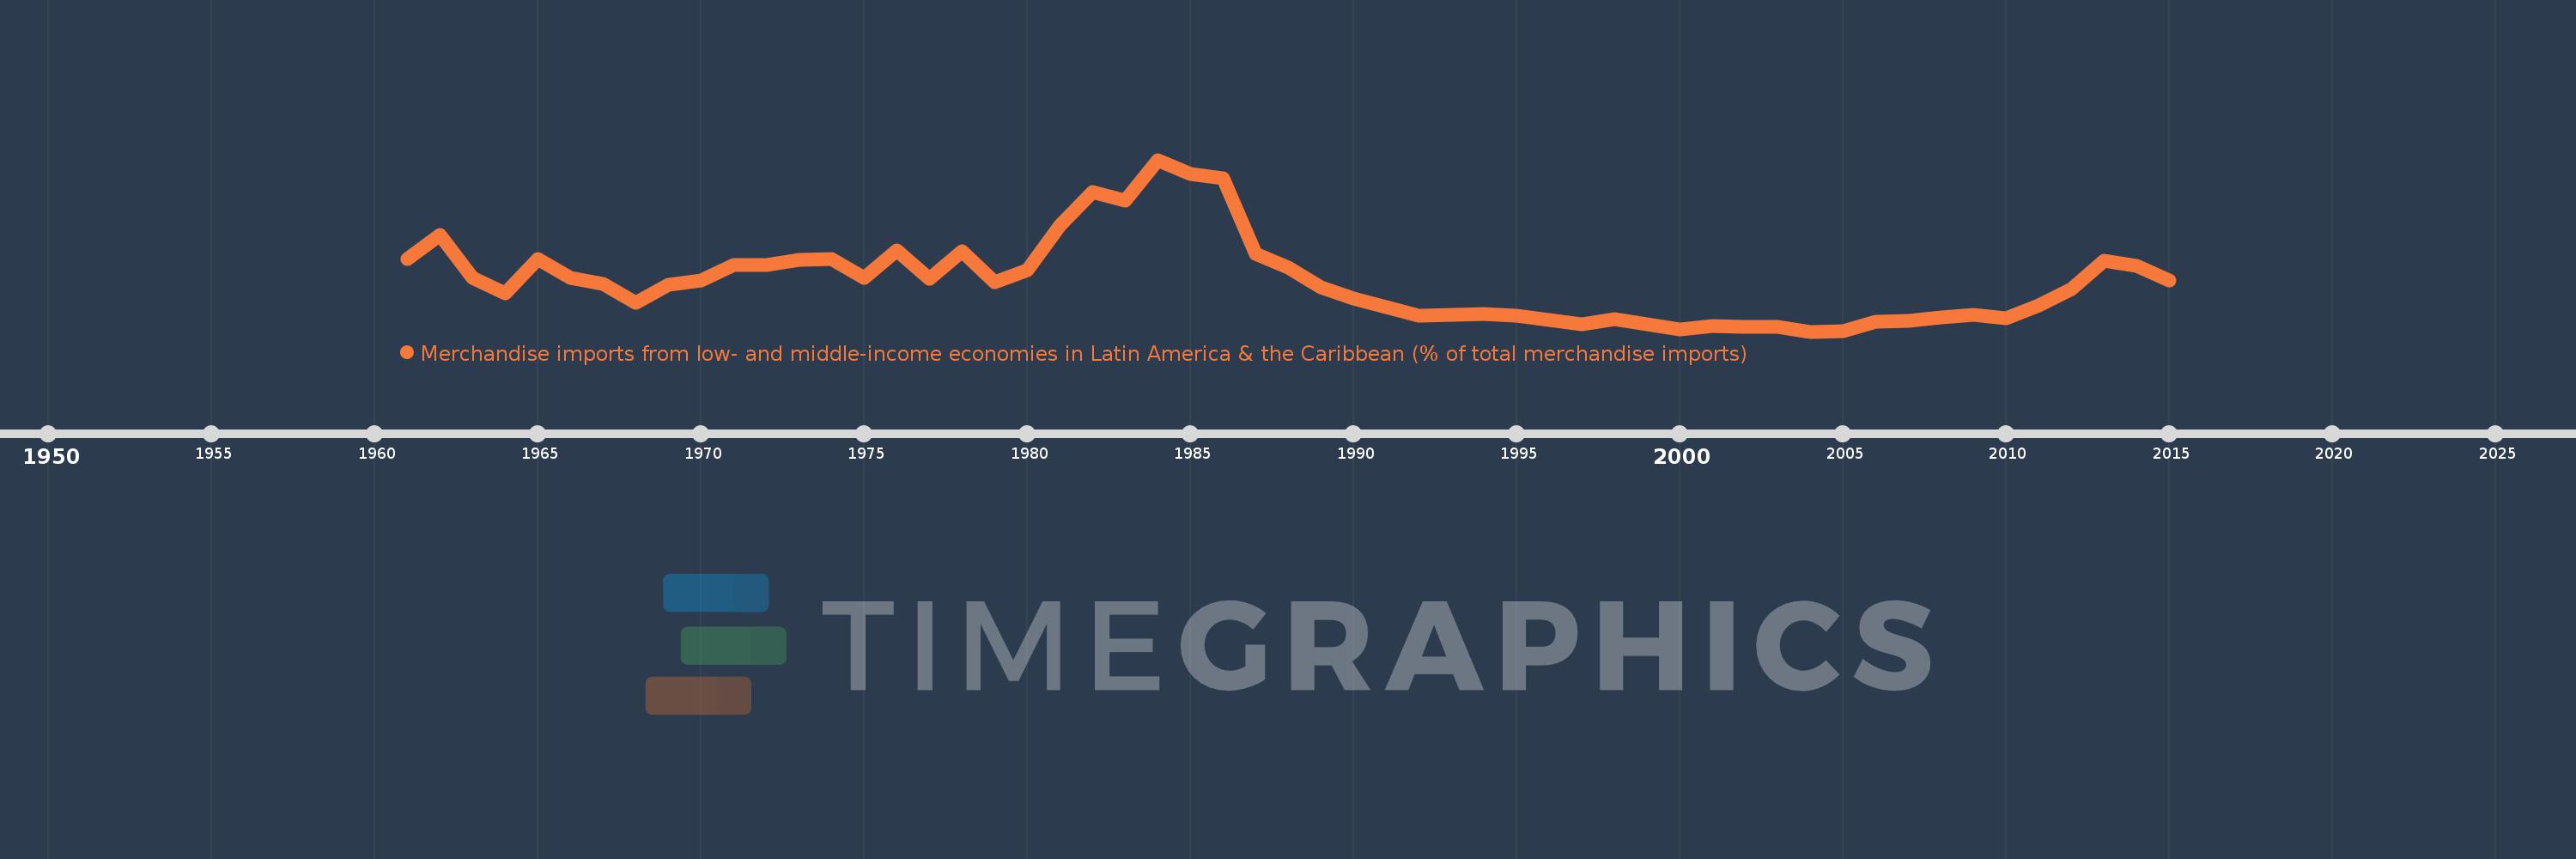
Merchandise imports from low- and middle-income economies in Latin America & the Caribbean (% of total merchandise imports)
2015,2014,2013,2012,2011,2010,2009,2008,2007,2006,2005,2004,2003,2002,2001,2000,1999,1998,1997,1996,1995,1994,1993,1992,1991,1990,1989,1988,1987,1986,1985,1984,1983,1982,1981,1980,1979,1978,1977,1976,1975,1974,1973,1972,1971,1970,1969,1968,1967,1966,1965,1964,1963,1962,1961
Global statistics library →Spain →Merchandise imports from low- and middle-income economies in Latin America & the Caribbean (% of total merchandise imports)
This statistics in other country:
AfghanistanAlbaniaAlgeriaAngolaAntigua and BarbudaArab WorldArgentinaArmeniaArubaAustraliaAustriaAzerbaijanBahamas, TheBahrainBangladeshBarbadosBelarusBelgiumBelizeBeninBermudaBoliviaBrazilBrunei DarussalamBulgariaBurkina FasoCabo VerdeCambodiaCameroonCanadaCaribbean small statesCentral African RepublicCentral Europe and the BalticsChileChinaColombiaCongo, Dem. Rep.Congo, Rep.Costa RicaCote d'IvoireCroatiaCubaCyprusCzech RepublicDenmarkDominicaDominican RepublicEarly-demographic dividendEast Asia & PacificEast Asia & Pacific (excluding high income)East Asia & Pacific (IDA & IBRD countries)EcuadorEgypt, Arab Rep.El SalvadorEstoniaEthiopiaEuro areaEurope & Central AsiaEurope & Central Asia (excluding high income)Europe & Central Asia (IDA & IBRD countries)European UnionFaroe IslandsFijiFinlandFragile and conflict affected situationsFranceFrench PolynesiaGabonGambia, TheGeorgiaGermanyGhanaGibraltarGreeceGreenlandGrenadaGuatemalaGuineaGuyanaHaitiHeavily indebted poor countries (HIPC)High incomeHondurasHong Kong SAR, ChinaHungaryIBRD onlyIcelandIDA & IBRD totalIDA blendIDA onlyIDA totalIndiaIndonesiaIran, Islamic Rep.IraqIrelandIsraelItalyJamaicaJapanJordanKazakhstanKenyaKorea, Dem. People’s Rep.Korea, Rep.KuwaitKyrgyz RepublicLate-demographic dividendLatin America & Caribbean Latin America & Caribbean (excluding high income)Latin America & the Caribbean (IDA & IBRD countries)LatviaLeast developed countries: UN classificationLebanonLiberiaLibyaLithuaniaLow & middle incomeLow incomeLower middle incomeLuxembourgMacao SAR, ChinaMacedonia, FYRMadagascarMalawiMalaysiaMaldivesMaliMaltaMauritaniaMauritiusMexicoMiddle East & North AfricaMiddle East & North Africa (excluding high income)Middle East & North Africa (IDA & IBRD countries)Middle incomeMoldovaMongoliaMontenegroMoroccoMozambiqueNetherlandsNew CaledoniaNew ZealandNicaraguaNigerNigeriaNorth AmericaNorwayOECD membersOmanOther small statesPacific island small statesPakistanPanamaPapua New GuineaParaguayPeruPhilippinesPolandPortugalPost-demographic dividendPre-demographic dividendQatarRomaniaRussian FederationSaudi ArabiaSenegalSerbiaSierra LeoneSingaporeSlovak RepublicSloveniaSmall statesSomaliaSouth AfricaSouth AsiaSouth Asia (IDA & IBRD)SpainSri LankaSt. Kitts and NevisSt. LuciaSt. Vincent and the GrenadinesSub-Saharan Africa Sub-Saharan Africa (excluding high income)Sub-Saharan Africa (IDA & IBRD countries)SudanSurinameSwedenSwitzerlandSyrian Arab RepublicTanzaniaThailandTogoTrinidad and TobagoTunisiaTurkeyUgandaUkraineUnited Arab EmiratesUnited KingdomUnited StatesUpper middle incomeUruguayVenezuela, RBVietnamWorldYemen, Rep.ZambiaZimbabwe Timeline:
This timeline shows a graph from 1961 to 2015 of Spain. No data until 1960. Number of actual observations by date: 55.
Source name:
World Development Indicators
Source organization:
World Bank staff estimates based data from International Monetary Fund's Direction of Trade database.
Categories, topics:
Private Sector, Trade
Last updated:
apr 23, 2017
Indicators value changes by year
Maximum:
10.072
jan 1, 1984
At the date of observation
Value
Absolute change
Change from previous value
jan 1, 1961
5.561
+5.561
0.0%
jan 1, 1962
6.649
+1.088
19.57%
jan 1, 1963
4.714
-1.935
-29.1%
jan 1, 1964
4.012
-0.702
-14.88%
jan 1, 1965
5.572
+1.56
38.88%
jan 1, 1966
4.705
-0.867
-15.57%
jan 1, 1967
4.448
-0.257
-5.47%
jan 1, 1968
3.592
-0.855
-19.23%
jan 1, 1969
4.391
+0.799
22.23%
jan 1, 1970
4.61
+0.219
4.99%
jan 1, 1971
5.291
+0.68
14.76%
jan 1, 1972
5.307
+0.016
0.3%
jan 1, 1973
5.529
+0.222
4.19%
jan 1, 1974
5.572
+0.043
0.77%
jan 1, 1975
4.728
-0.843
-15.14%
jan 1, 1976
5.969
+1.24
26.23%
jan 1, 1977
4.678
-1.29
-21.62%
jan 1, 1978
5.922
+1.243
26.58%
jan 1, 1979
4.513
-1.409
-23.79%
jan 1, 1980
5.062
+0.549
12.17%
jan 1, 1981
7.075
+2.013
39.77%
jan 1, 1982
8.604
+1.529
21.61%
jan 1, 1983
8.211
-0.393
-4.57%
jan 1, 1984
10.072
+1.861
22.67%
jan 1, 1985
9.441
-0.631
-6.26%
jan 1, 1986
9.232
-0.209
-2.21%
jan 1, 1987
5.787
-3.445
-37.32%
jan 1, 1988
5.198
-0.589
-10.17%
jan 1, 1989
4.263
-0.935
-18.0%
jan 1, 1990
3.771
-0.491
-11.53%
jan 1, 1991
3.401
-0.37
-9.82%
jan 1, 1992
3.014
-0.387
-11.39%
jan 1, 1993
3.022
+0.008
0.27%
jan 1, 1994
3.066
+0.044
1.46%
jan 1, 1995
3.001
-0.065
-2.11%
jan 1, 1996
2.807
-0.194
-6.48%
jan 1, 1997
2.609
-0.198
-7.06%
jan 1, 1998
2.831
+0.223
8.53%
jan 1, 1999
2.622
-0.21
-7.4%
jan 1, 2000
2.367
-0.254
-9.71%
jan 1, 2001
2.509
+0.141
5.97%
jan 1, 2002
2.484
-0.025
-1.0%
jan 1, 2003
2.473
-0.01
-0.41%
jan 1, 2004
2.274
-0.199
-8.06%
jan 1, 2005
2.311
+0.037
1.61%
jan 1, 2006
2.738
+0.427
18.47%
jan 1, 2007
2.745
+0.007
0.27%
jan 1, 2008
2.929
+0.184
6.69%
jan 1, 2009
3.042
+0.113
3.86%
jan 1, 2010
2.894
-0.148
-4.88%
jan 1, 2011
3.468
+0.574
19.84%
jan 1, 2012
4.202
+0.735
21.18%
jan 1, 2013
5.494
+1.292
30.74%
jan 1, 2014
5.246
-0.248
-4.51%
jan 1, 2015
4.6
-0.646
-12.32%
Ranking of countries by current statistics by years


Comments: