29
/
en
AIzaSyAYiBZKx7MnpbEhh9jyipgxe19OcubqV5w
April 1, 2024
222486
Peru
PER
true
2
1
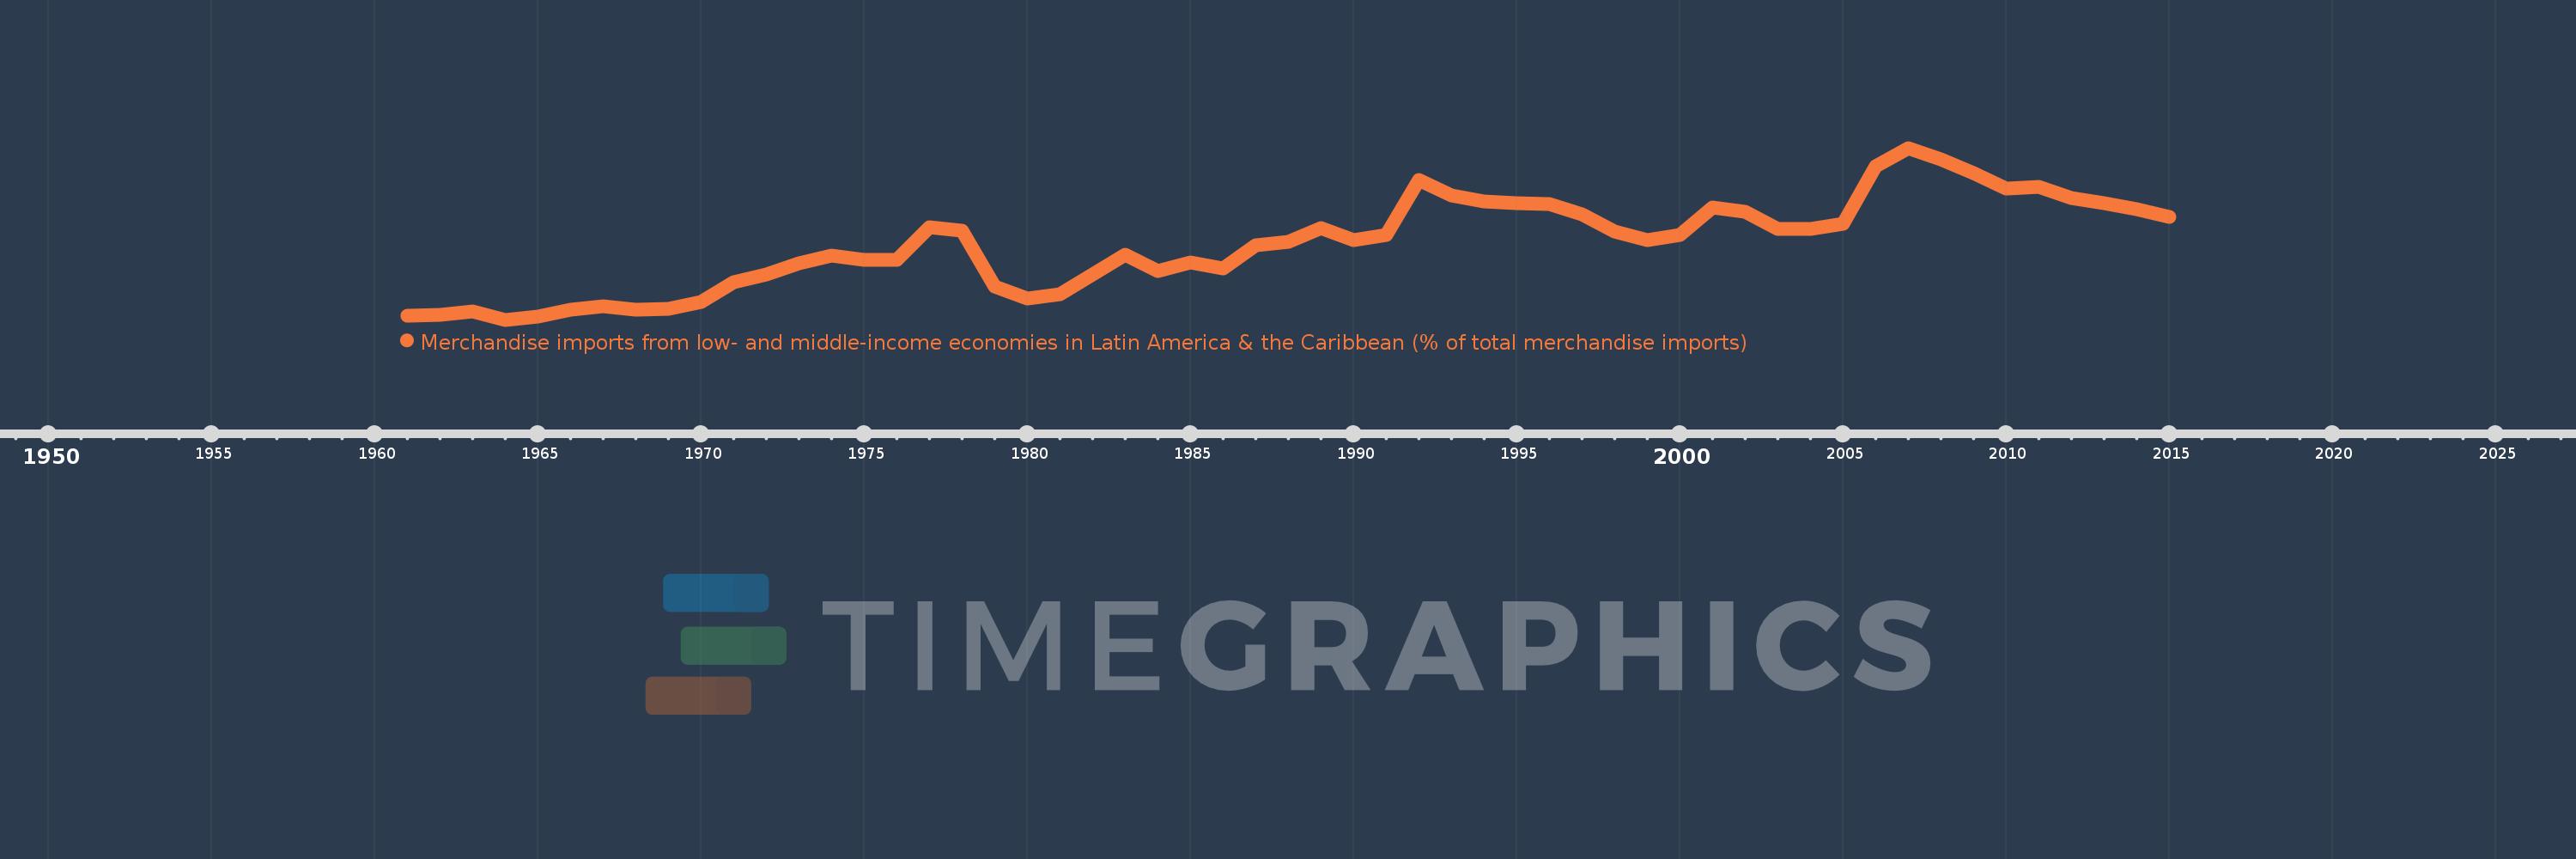
Merchandise imports from low- and middle-income economies in Latin America & the Caribbean (% of total merchandise imports)
2015,2014,2013,2012,2011,2010,2009,2008,2007,2006,2005,2004,2003,2002,2001,2000,1999,1998,1997,1996,1995,1994,1993,1992,1991,1990,1989,1988,1987,1986,1985,1984,1983,1982,1981,1980,1979,1978,1977,1976,1975,1974,1973,1972,1971,1970,1969,1968,1967,1966,1965,1964,1963,1962,1961
Global statistics library →Peru →Merchandise imports from low- and middle-income economies in Latin America & the Caribbean (% of total merchandise imports)
This statistics in other country:
AfghanistanAlbaniaAlgeriaAngolaAntigua and BarbudaArab WorldArgentinaArmeniaArubaAustraliaAustriaAzerbaijanBahamas, TheBahrainBangladeshBarbadosBelarusBelgiumBelizeBeninBermudaBoliviaBrazilBrunei DarussalamBulgariaBurkina FasoCabo VerdeCambodiaCameroonCanadaCaribbean small statesCentral African RepublicCentral Europe and the BalticsChileChinaColombiaCongo, Dem. Rep.Congo, Rep.Costa RicaCote d'IvoireCroatiaCubaCyprusCzech RepublicDenmarkDominicaDominican RepublicEarly-demographic dividendEast Asia & PacificEast Asia & Pacific (excluding high income)East Asia & Pacific (IDA & IBRD countries)EcuadorEgypt, Arab Rep.El SalvadorEstoniaEthiopiaEuro areaEurope & Central AsiaEurope & Central Asia (excluding high income)Europe & Central Asia (IDA & IBRD countries)European UnionFaroe IslandsFijiFinlandFragile and conflict affected situationsFranceFrench PolynesiaGabonGambia, TheGeorgiaGermanyGhanaGibraltarGreeceGreenlandGrenadaGuatemalaGuineaGuyanaHaitiHeavily indebted poor countries (HIPC)High incomeHondurasHong Kong SAR, ChinaHungaryIBRD onlyIcelandIDA & IBRD totalIDA blendIDA onlyIDA totalIndiaIndonesiaIran, Islamic Rep.IraqIrelandIsraelItalyJamaicaJapanJordanKazakhstanKenyaKorea, Dem. People’s Rep.Korea, Rep.KuwaitKyrgyz RepublicLate-demographic dividendLatin America & Caribbean Latin America & Caribbean (excluding high income)Latin America & the Caribbean (IDA & IBRD countries)LatviaLeast developed countries: UN classificationLebanonLiberiaLibyaLithuaniaLow & middle incomeLow incomeLower middle incomeLuxembourgMacao SAR, ChinaMacedonia, FYRMadagascarMalawiMalaysiaMaldivesMaliMaltaMauritaniaMauritiusMexicoMiddle East & North AfricaMiddle East & North Africa (excluding high income)Middle East & North Africa (IDA & IBRD countries)Middle incomeMoldovaMongoliaMontenegroMoroccoMozambiqueNetherlandsNew CaledoniaNew ZealandNicaraguaNigerNigeriaNorth AmericaNorwayOECD membersOmanOther small statesPacific island small statesPakistanPanamaPapua New GuineaParaguayPeruPhilippinesPolandPortugalPost-demographic dividendPre-demographic dividendQatarRomaniaRussian FederationSaudi ArabiaSenegalSerbiaSierra LeoneSingaporeSlovak RepublicSloveniaSmall statesSomaliaSouth AfricaSouth AsiaSouth Asia (IDA & IBRD)SpainSri LankaSt. Kitts and NevisSt. LuciaSt. Vincent and the GrenadinesSub-Saharan Africa Sub-Saharan Africa (excluding high income)Sub-Saharan Africa (IDA & IBRD countries)SudanSurinameSwedenSwitzerlandSyrian Arab RepublicTanzaniaThailandTogoTrinidad and TobagoTunisiaTurkeyUgandaUkraineUnited Arab EmiratesUnited KingdomUnited StatesUpper middle incomeUruguayVenezuela, RBVietnamWorldYemen, Rep.ZambiaZimbabwe Timeline:
This timeline shows a graph from 1961 to 2015 of Peru. No data until 1960. Number of actual observations by date: 55.
Source name:
World Development Indicators
Source organization:
World Bank staff estimates based data from International Monetary Fund's Direction of Trade database.
Categories, topics:
Private Sector, Trade
Last updated:
apr 23, 2017
Indicators value changes by year
Maximum:
29.694
jan 1, 2007
At the date of observation
Value
Absolute change
Change from previous value
jan 1, 1961
2.359
+2.359
0.0%
jan 1, 1962
2.518
+0.159
6.73%
jan 1, 1963
3.018
+0.5
19.87%
jan 1, 1964
1.688
-1.331
-44.08%
jan 1, 1965
2.177
+0.489
28.97%
jan 1, 1966
3.361
+1.184
54.4%
jan 1, 1967
3.879
+0.518
15.41%
jan 1, 1968
3.393
-0.486
-12.53%
jan 1, 1969
3.444
+0.051
1.5%
jan 1, 1970
4.646
+1.202
34.91%
jan 1, 1971
7.782
+3.136
67.48%
jan 1, 1972
9.052
+1.27
16.32%
jan 1, 1973
10.9
+1.848
20.42%
jan 1, 1974
12.14
+1.24
11.37%
jan 1, 1975
11.429
-0.71
-5.85%
jan 1, 1976
11.508
+0.079
0.69%
jan 1, 1977
16.778
+5.271
45.8%
jan 1, 1978
16.231
-0.547
-3.26%
jan 1, 1979
7.149
-9.083
-55.96%
jan 1, 1980
5.2
-1.949
-27.26%
jan 1, 1981
5.813
+0.613
11.79%
jan 1, 1982
9.047
+3.235
55.65%
jan 1, 1983
12.342
+3.295
36.42%
jan 1, 1984
9.623
-2.719
-22.03%
jan 1, 1985
11.03
+1.407
14.62%
jan 1, 1986
10.021
-1.009
-9.15%
jan 1, 1987
13.799
+3.778
37.7%
jan 1, 1988
14.426
+0.627
4.54%
jan 1, 1989
16.581
+2.155
14.94%
jan 1, 1990
14.607
-1.974
-11.91%
jan 1, 1991
15.464
+0.857
5.87%
jan 1, 1992
24.508
+9.044
58.48%
jan 1, 1993
21.983
-2.525
-10.3%
jan 1, 1994
21.02
-0.963
-4.38%
jan 1, 1995
20.678
-0.342
-1.63%
jan 1, 1996
20.617
-0.061
-0.3%
jan 1, 1997
18.858
-1.759
-8.53%
jan 1, 1998
16.036
-2.822
-14.97%
jan 1, 1999
14.664
-1.372
-8.56%
jan 1, 2000
15.445
+0.781
5.33%
jan 1, 2001
20.013
+4.568
29.57%
jan 1, 2002
19.285
-0.728
-3.64%
jan 1, 2003
16.524
-2.761
-14.32%
jan 1, 2004
16.498
-0.026
-0.16%
jan 1, 2005
17.338
+0.84
5.09%
jan 1, 2006
26.736
+9.398
54.21%
jan 1, 2007
29.694
+2.958
11.06%
jan 1, 2008
27.797
-1.897
-6.39%
jan 1, 2009
25.558
-2.239
-8.06%
jan 1, 2010
23.139
-2.419
-9.46%
jan 1, 2011
23.341
+0.202
0.87%
jan 1, 2012
21.483
-1.858
-7.96%
jan 1, 2013
20.735
-0.747
-3.48%
jan 1, 2014
19.703
-1.033
-4.98%
jan 1, 2015
18.498
-1.205
-6.12%
Ranking of countries by current statistics by years


Comments: