29
/
en
AIzaSyAYiBZKx7MnpbEhh9jyipgxe19OcubqV5w
April 1, 2024
31829
Europe & Central Asia (excluding high income)
ECA
false
2
1
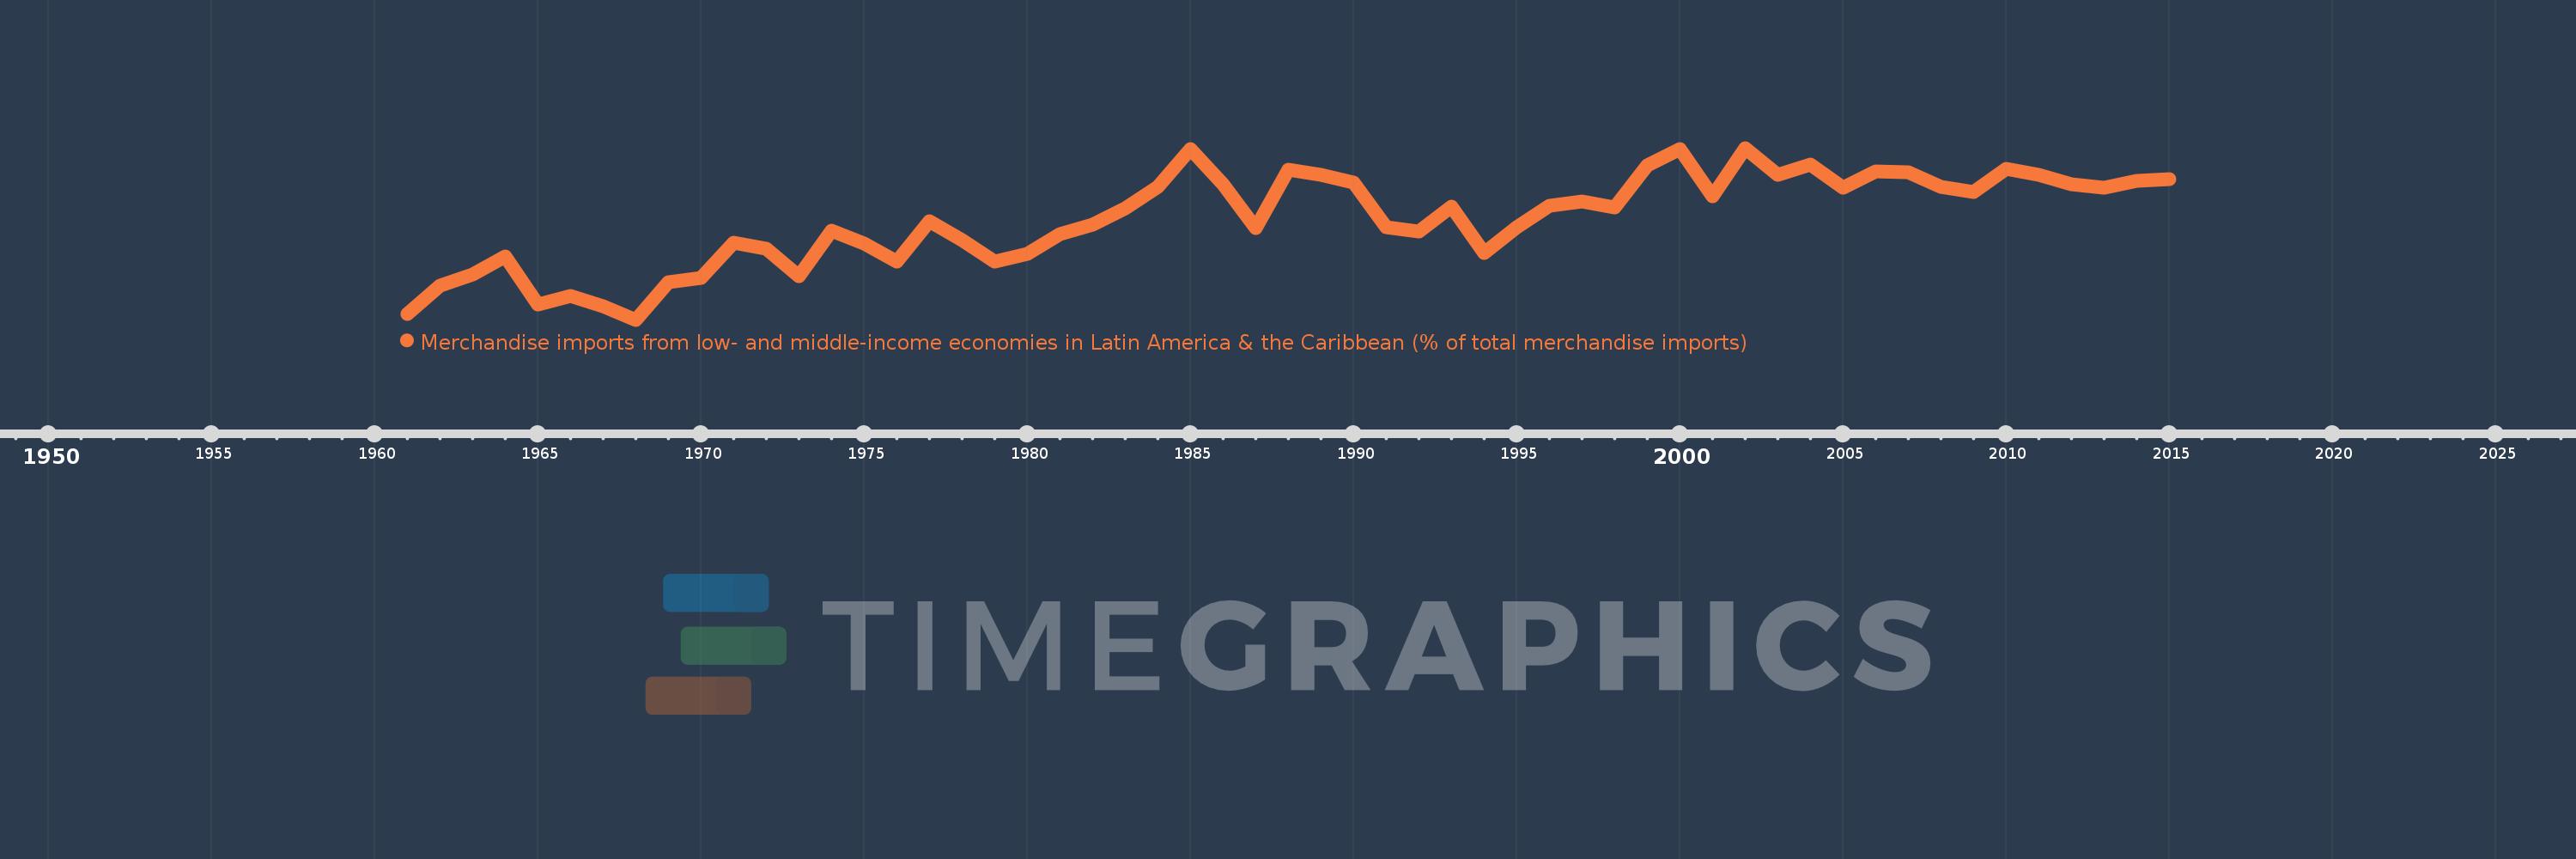
Merchandise imports from low- and middle-income economies in Latin America & the Caribbean (% of total merchandise imports)
2015,2014,2013,2012,2011,2010,2009,2008,2007,2006,2005,2004,2003,2002,2001,2000,1999,1998,1997,1996,1995,1994,1993,1992,1991,1990,1989,1988,1987,1986,1985,1984,1983,1982,1981,1980,1979,1978,1977,1976,1975,1974,1973,1972,1971,1970,1969,1968,1967,1966,1965,1964,1963,1962,1961
This statistics in other country:
AfghanistanAlbaniaAlgeriaAngolaAntigua and BarbudaArab WorldArgentinaArmeniaArubaAustraliaAustriaAzerbaijanBahamas, TheBahrainBangladeshBarbadosBelarusBelgiumBelizeBeninBermudaBoliviaBrazilBrunei DarussalamBulgariaBurkina FasoCabo VerdeCambodiaCameroonCanadaCaribbean small statesCentral African RepublicCentral Europe and the BalticsChileChinaColombiaCongo, Dem. Rep.Congo, Rep.Costa RicaCote d'IvoireCroatiaCubaCyprusCzech RepublicDenmarkDominicaDominican RepublicEarly-demographic dividendEast Asia & PacificEast Asia & Pacific (excluding high income)East Asia & Pacific (IDA & IBRD countries)EcuadorEgypt, Arab Rep.El SalvadorEstoniaEthiopiaEuro areaEurope & Central AsiaEurope & Central Asia (excluding high income)Europe & Central Asia (IDA & IBRD countries)European UnionFaroe IslandsFijiFinlandFragile and conflict affected situationsFranceFrench PolynesiaGabonGambia, TheGeorgiaGermanyGhanaGibraltarGreeceGreenlandGrenadaGuatemalaGuineaGuyanaHaitiHeavily indebted poor countries (HIPC)High incomeHondurasHong Kong SAR, ChinaHungaryIBRD onlyIcelandIDA & IBRD totalIDA blendIDA onlyIDA totalIndiaIndonesiaIran, Islamic Rep.IraqIrelandIsraelItalyJamaicaJapanJordanKazakhstanKenyaKorea, Dem. People’s Rep.Korea, Rep.KuwaitKyrgyz RepublicLate-demographic dividendLatin America & Caribbean Latin America & Caribbean (excluding high income)Latin America & the Caribbean (IDA & IBRD countries)LatviaLeast developed countries: UN classificationLebanonLiberiaLibyaLithuaniaLow & middle incomeLow incomeLower middle incomeLuxembourgMacao SAR, ChinaMacedonia, FYRMadagascarMalawiMalaysiaMaldivesMaliMaltaMauritaniaMauritiusMexicoMiddle East & North AfricaMiddle East & North Africa (excluding high income)Middle East & North Africa (IDA & IBRD countries)Middle incomeMoldovaMongoliaMontenegroMoroccoMozambiqueNetherlandsNew CaledoniaNew ZealandNicaraguaNigerNigeriaNorth AmericaNorwayOECD membersOmanOther small statesPacific island small statesPakistanPanamaPapua New GuineaParaguayPeruPhilippinesPolandPortugalPost-demographic dividendPre-demographic dividendQatarRomaniaRussian FederationSaudi ArabiaSenegalSerbiaSierra LeoneSingaporeSlovak RepublicSloveniaSmall statesSomaliaSouth AfricaSouth AsiaSouth Asia (IDA & IBRD)SpainSri LankaSt. Kitts and NevisSt. LuciaSt. Vincent and the GrenadinesSub-Saharan Africa Sub-Saharan Africa (excluding high income)Sub-Saharan Africa (IDA & IBRD countries)SudanSurinameSwedenSwitzerlandSyrian Arab RepublicTanzaniaThailandTogoTrinidad and TobagoTunisiaTurkeyUgandaUkraineUnited Arab EmiratesUnited KingdomUnited StatesUpper middle incomeUruguayVenezuela, RBVietnamWorldYemen, Rep.ZambiaZimbabwe Timeline:
This timeline shows a graph from 1961 to 2015 of Europe & Central Asia (excluding high income). No data until 1960. Number of actual observations by date: 55.
Source name:
World Development Indicators
Source organization:
World Bank staff estimates based data from International Monetary Fund's Direction of Trade database.
Categories, topics:
Private Sector, Trade
Last updated:
apr 23, 2017
Indicators value changes by year
At the date of observation
Value
Absolute change
Change from previous value
jan 1, 1961
0.19
+0.19
0.0%
jan 1, 1962
0.503
+0.313
164.61%
jan 1, 1963
0.637
+0.134
26.68%
jan 1, 1964
0.841
+0.204
32.05%
jan 1, 1965
0.294
-0.547
-64.99%
jan 1, 1966
0.393
+0.099
33.49%
jan 1, 1967
0.274
-0.119
-30.17%
jan 1, 1968
0.12
-0.155
-56.42%
jan 1, 1969
0.549
+0.43
359.17%
jan 1, 1970
0.599
+0.049
9.01%
jan 1, 1971
0.999
+0.4
66.84%
jan 1, 1972
0.925
-0.074
-7.38%
jan 1, 1973
0.613
-0.312
-33.75%
jan 1, 1974
1.129
+0.516
84.26%
jan 1, 1975
0.983
-0.146
-12.97%
jan 1, 1976
0.782
-0.2
-20.39%
jan 1, 1977
1.245
+0.463
59.15%
jan 1, 1978
1.03
-0.215
-17.28%
jan 1, 1979
0.781
-0.249
-24.14%
jan 1, 1980
0.871
+0.089
11.43%
jan 1, 1981
1.098
+0.227
26.12%
jan 1, 1982
1.201
+0.103
9.4%
jan 1, 1983
1.387
+0.186
15.45%
jan 1, 1984
1.633
+0.247
17.77%
jan 1, 1985
2.059
+0.425
26.04%
jan 1, 1986
1.66
-0.399
-19.37%
jan 1, 1987
1.162
-0.498
-30.01%
jan 1, 1988
1.823
+0.662
56.94%
jan 1, 1989
1.771
-0.052
-2.87%
jan 1, 1990
1.682
-0.089
-5.04%
jan 1, 1991
1.17
-0.512
-30.44%
jan 1, 1992
1.128
-0.041
-3.54%
jan 1, 1993
1.403
+0.275
24.33%
jan 1, 1994
0.883
-0.52
-37.07%
jan 1, 1995
1.174
+0.291
32.98%
jan 1, 1996
1.42
+0.246
20.97%
jan 1, 1997
1.464
+0.044
3.07%
jan 1, 1998
1.396
-0.068
-4.67%
jan 1, 1999
1.876
+0.481
34.43%
jan 1, 2000
2.063
+0.186
9.93%
jan 1, 2001
1.528
-0.534
-25.9%
jan 1, 2002
2.074
+0.546
35.7%
jan 1, 2003
1.766
-0.308
-14.86%
jan 1, 2004
1.886
+0.121
6.83%
jan 1, 2005
1.62
-0.266
-14.12%
jan 1, 2006
1.804
+0.184
11.38%
jan 1, 2007
1.797
-0.008
-0.43%
jan 1, 2008
1.634
-0.163
-9.06%
jan 1, 2009
1.571
-0.063
-3.84%
jan 1, 2010
1.838
+0.267
17.0%
jan 1, 2011
1.768
-0.07
-3.83%
jan 1, 2012
1.664
-0.104
-5.89%
jan 1, 2013
1.618
-0.046
-2.77%
jan 1, 2014
1.696
+0.078
4.82%
jan 1, 2015
1.718
+0.022
1.32%
Ranking of countries by current statistics by years


Comments: