29
/
en
AIzaSyAYiBZKx7MnpbEhh9jyipgxe19OcubqV5w
April 1, 2024
51130
Middle income
MIC
false
2
1
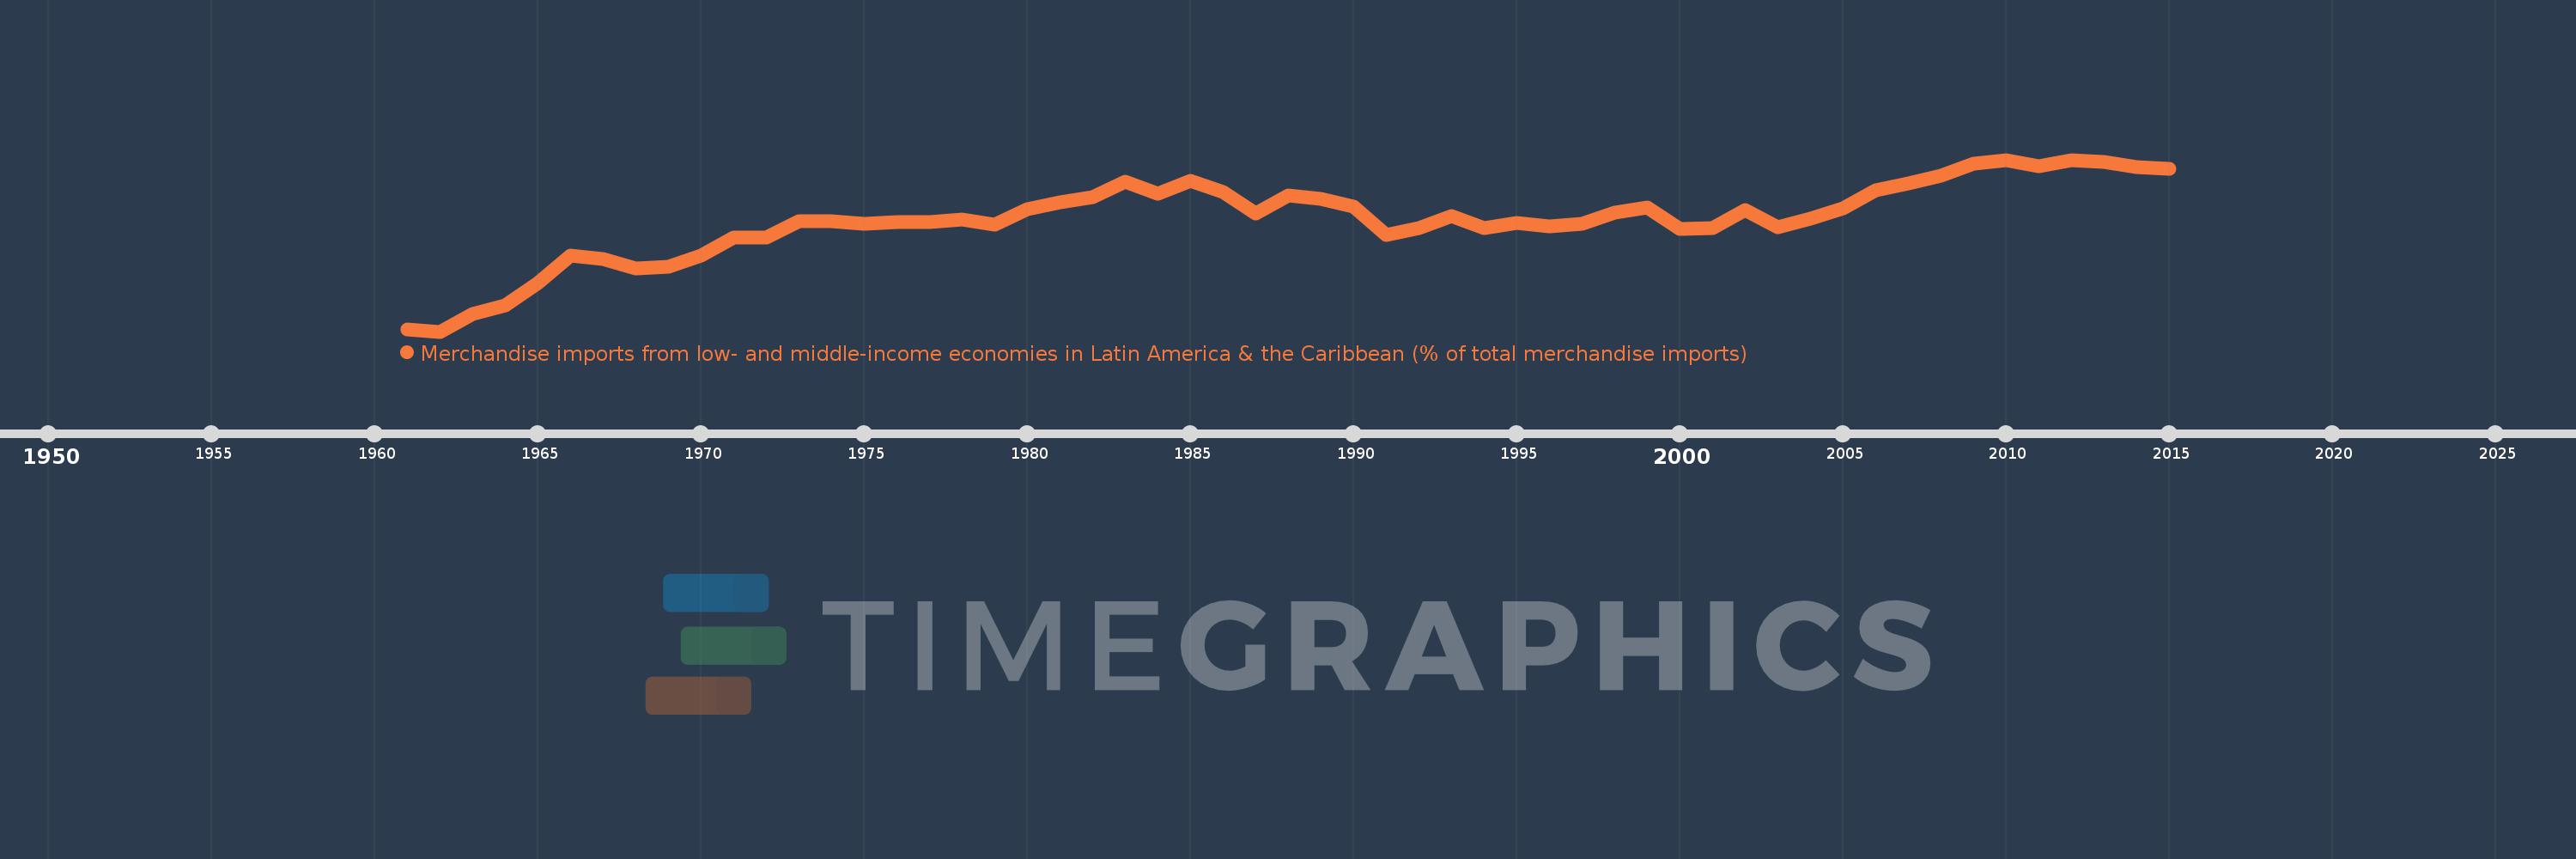
Merchandise imports from low- and middle-income economies in Latin America & the Caribbean (% of total merchandise imports)
2015,2014,2013,2012,2011,2010,2009,2008,2007,2006,2005,2004,2003,2002,2001,2000,1999,1998,1997,1996,1995,1994,1993,1992,1991,1990,1989,1988,1987,1986,1985,1984,1983,1982,1981,1980,1979,1978,1977,1976,1975,1974,1973,1972,1971,1970,1969,1968,1967,1966,1965,1964,1963,1962,1961
This statistics in other country:
AfghanistanAlbaniaAlgeriaAngolaAntigua and BarbudaArab WorldArgentinaArmeniaArubaAustraliaAustriaAzerbaijanBahamas, TheBahrainBangladeshBarbadosBelarusBelgiumBelizeBeninBermudaBoliviaBrazilBrunei DarussalamBulgariaBurkina FasoCabo VerdeCambodiaCameroonCanadaCaribbean small statesCentral African RepublicCentral Europe and the BalticsChileChinaColombiaCongo, Dem. Rep.Congo, Rep.Costa RicaCote d'IvoireCroatiaCubaCyprusCzech RepublicDenmarkDominicaDominican RepublicEarly-demographic dividendEast Asia & PacificEast Asia & Pacific (excluding high income)East Asia & Pacific (IDA & IBRD countries)EcuadorEgypt, Arab Rep.El SalvadorEstoniaEthiopiaEuro areaEurope & Central AsiaEurope & Central Asia (excluding high income)Europe & Central Asia (IDA & IBRD countries)European UnionFaroe IslandsFijiFinlandFragile and conflict affected situationsFranceFrench PolynesiaGabonGambia, TheGeorgiaGermanyGhanaGibraltarGreeceGreenlandGrenadaGuatemalaGuineaGuyanaHaitiHeavily indebted poor countries (HIPC)High incomeHondurasHong Kong SAR, ChinaHungaryIBRD onlyIcelandIDA & IBRD totalIDA blendIDA onlyIDA totalIndiaIndonesiaIran, Islamic Rep.IraqIrelandIsraelItalyJamaicaJapanJordanKazakhstanKenyaKorea, Dem. People’s Rep.Korea, Rep.KuwaitKyrgyz RepublicLate-demographic dividendLatin America & Caribbean Latin America & Caribbean (excluding high income)Latin America & the Caribbean (IDA & IBRD countries)LatviaLeast developed countries: UN classificationLebanonLiberiaLibyaLithuaniaLow & middle incomeLow incomeLower middle incomeLuxembourgMacao SAR, ChinaMacedonia, FYRMadagascarMalawiMalaysiaMaldivesMaliMaltaMauritaniaMauritiusMexicoMiddle East & North AfricaMiddle East & North Africa (excluding high income)Middle East & North Africa (IDA & IBRD countries)Middle incomeMoldovaMongoliaMontenegroMoroccoMozambiqueNetherlandsNew CaledoniaNew ZealandNicaraguaNigerNigeriaNorth AmericaNorwayOECD membersOmanOther small statesPacific island small statesPakistanPanamaPapua New GuineaParaguayPeruPhilippinesPolandPortugalPost-demographic dividendPre-demographic dividendQatarRomaniaRussian FederationSaudi ArabiaSenegalSerbiaSierra LeoneSingaporeSlovak RepublicSloveniaSmall statesSomaliaSouth AfricaSouth AsiaSouth Asia (IDA & IBRD)SpainSri LankaSt. Kitts and NevisSt. LuciaSt. Vincent and the GrenadinesSub-Saharan Africa Sub-Saharan Africa (excluding high income)Sub-Saharan Africa (IDA & IBRD countries)SudanSurinameSwedenSwitzerlandSyrian Arab RepublicTanzaniaThailandTogoTrinidad and TobagoTunisiaTurkeyUgandaUkraineUnited Arab EmiratesUnited KingdomUnited StatesUpper middle incomeUruguayVenezuela, RBVietnamWorldYemen, Rep.ZambiaZimbabwe Timeline:
This timeline shows a graph from 1961 to 2015 of Middle income. No data until 1960. Number of actual observations by date: 55.
Source name:
World Development Indicators
Source organization:
World Bank staff estimates based data from International Monetary Fund's Direction of Trade database.
Categories, topics:
Private Sector, Trade
Last updated:
apr 23, 2017
Indicators value changes by year
At the date of observation
Value
Absolute change
Change from previous value
jan 1, 1961
1.428
+1.428
0.0%
jan 1, 1962
1.392
-0.037
-2.57%
jan 1, 1963
1.711
+0.32
22.97%
jan 1, 1964
1.877
+0.166
9.69%
jan 1, 1965
2.279
+0.402
21.4%
jan 1, 1966
2.785
+0.506
22.21%
jan 1, 1967
2.717
-0.067
-2.42%
jan 1, 1968
2.545
-0.173
-6.36%
jan 1, 1969
2.578
+0.033
1.31%
jan 1, 1970
2.786
+0.208
8.07%
jan 1, 1971
3.11
+0.324
11.64%
jan 1, 1972
3.111
+0.001
0.04%
jan 1, 1973
3.421
+0.31
9.96%
jan 1, 1974
3.412
-0.009
-0.27%
jan 1, 1975
3.367
-0.045
-1.33%
jan 1, 1976
3.395
+0.029
0.85%
jan 1, 1977
3.394
-0.001
-0.03%
jan 1, 1978
3.453
+0.059
1.72%
jan 1, 1979
3.344
-0.109
-3.17%
jan 1, 1980
3.642
+0.298
8.91%
jan 1, 1981
3.759
+0.117
3.21%
jan 1, 1982
3.852
+0.094
2.49%
jan 1, 1983
4.146
+0.294
7.63%
jan 1, 1984
3.923
-0.224
-5.39%
jan 1, 1985
4.156
+0.233
5.95%
jan 1, 1986
3.954
-0.202
-4.86%
jan 1, 1987
3.55
-0.404
-10.21%
jan 1, 1988
3.889
+0.339
9.54%
jan 1, 1989
3.824
-0.065
-1.68%
jan 1, 1990
3.68
-0.144
-3.76%
jan 1, 1991
3.166
-0.514
-13.97%
jan 1, 1992
3.284
+0.118
3.73%
jan 1, 1993
3.504
+0.22
6.69%
jan 1, 1994
3.291
-0.212
-6.06%
jan 1, 1995
3.384
+0.093
2.82%
jan 1, 1996
3.319
-0.065
-1.93%
jan 1, 1997
3.373
+0.054
1.63%
jan 1, 1998
3.567
+0.194
5.74%
jan 1, 1999
3.664
+0.097
2.73%
jan 1, 2000
3.272
-0.392
-10.7%
jan 1, 2001
3.284
+0.012
0.36%
jan 1, 2002
3.621
+0.338
10.28%
jan 1, 2003
3.298
-0.323
-8.93%
jan 1, 2004
3.455
+0.157
4.77%
jan 1, 2005
3.654
+0.198
5.73%
jan 1, 2006
3.977
+0.324
8.86%
jan 1, 2007
4.103
+0.126
3.17%
jan 1, 2008
4.253
+0.15
3.65%
jan 1, 2009
4.468
+0.215
5.05%
jan 1, 2010
4.534
+0.066
1.48%
jan 1, 2011
4.416
-0.118
-2.6%
jan 1, 2012
4.54
+0.124
2.82%
jan 1, 2013
4.498
-0.042
-0.93%
jan 1, 2014
4.412
-0.086
-1.91%
jan 1, 2015
4.382
-0.03
-0.68%
Ranking of countries by current statistics by years


Comments: