29
/
en
AIzaSyAYiBZKx7MnpbEhh9jyipgxe19OcubqV5w
April 1, 2024
91445
Brazil
BRA
true
2
1
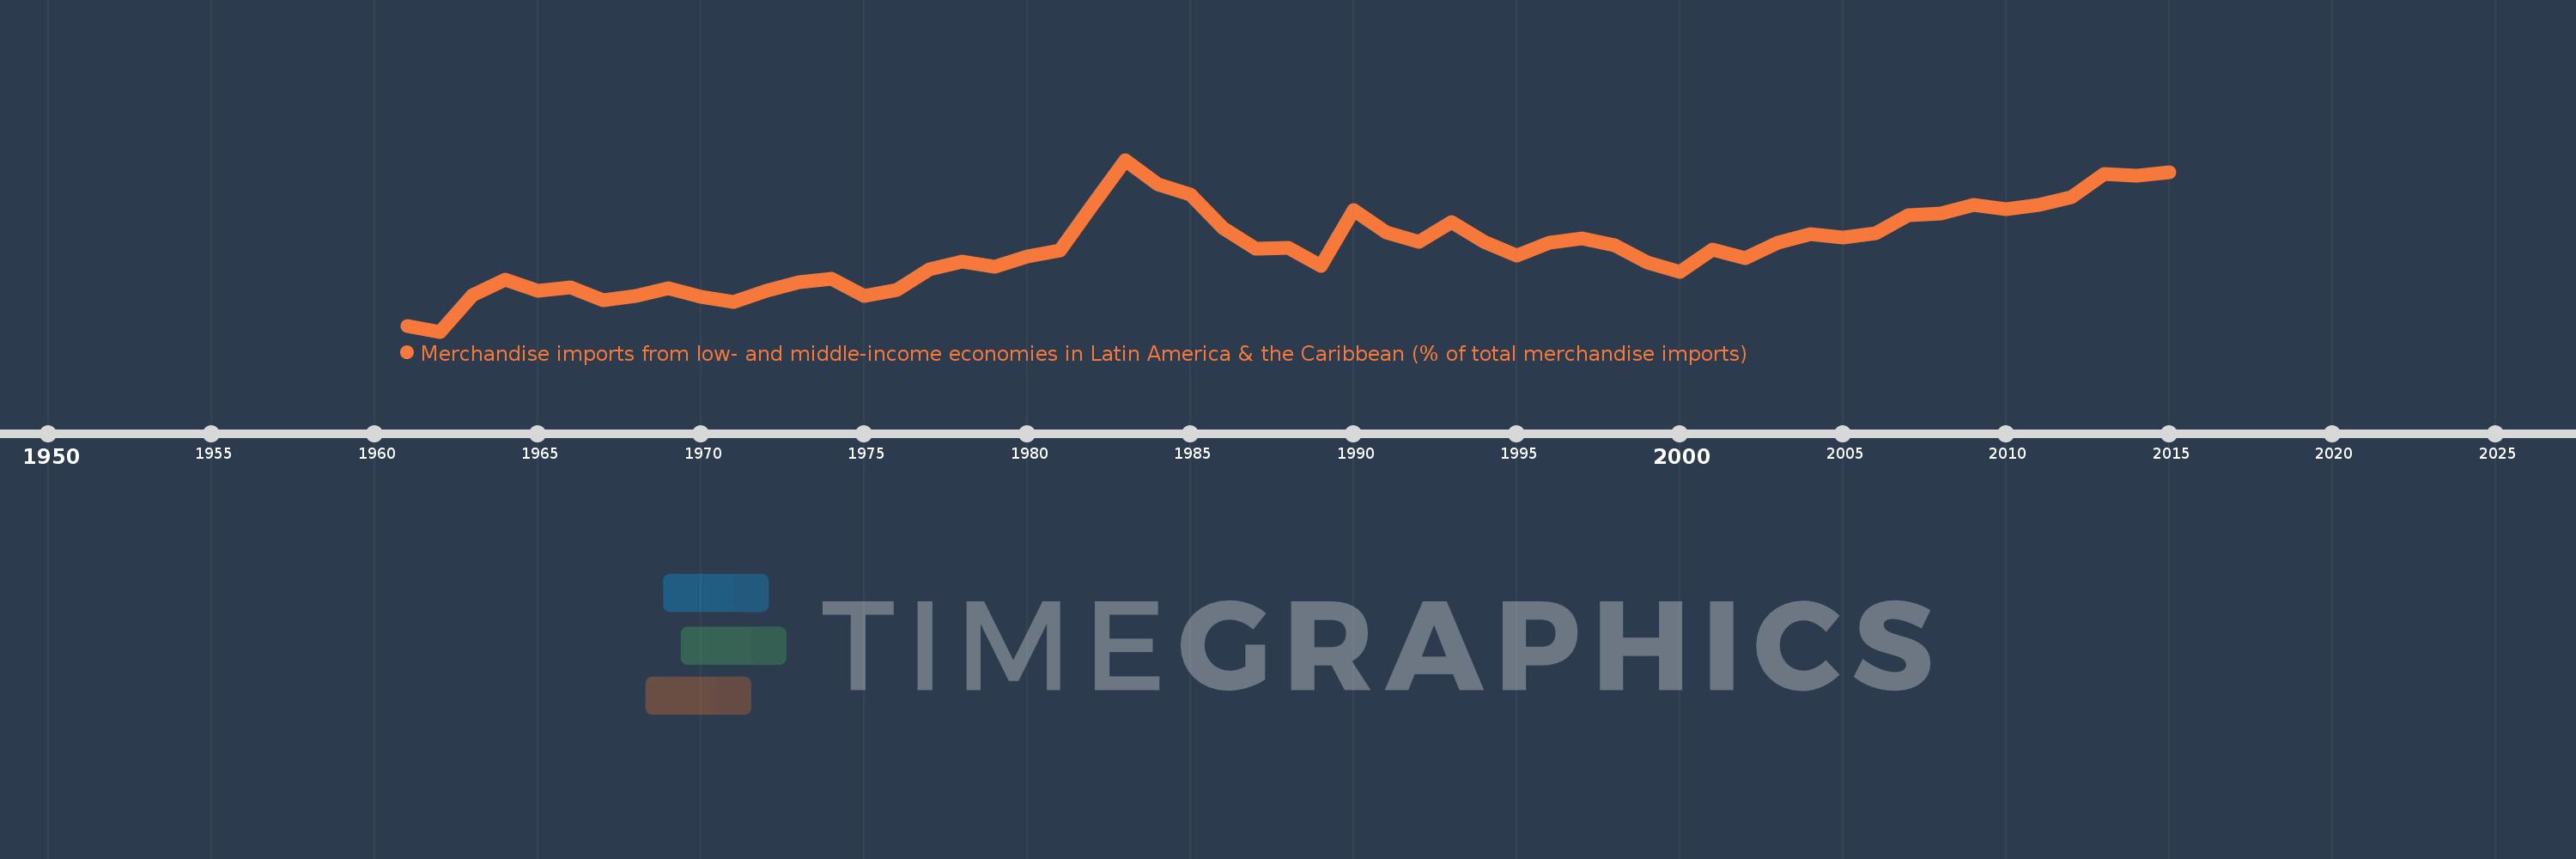
Merchandise imports from low- and middle-income economies in Latin America & the Caribbean (% of total merchandise imports)
2015,2014,2013,2012,2011,2010,2009,2008,2007,2006,2005,2004,2003,2002,2001,2000,1999,1998,1997,1996,1995,1994,1993,1992,1991,1990,1989,1988,1987,1986,1985,1984,1983,1982,1981,1980,1979,1978,1977,1976,1975,1974,1973,1972,1971,1970,1969,1968,1967,1966,1965,1964,1963,1962,1961
Global statistics library →Brazil →Merchandise imports from low- and middle-income economies in Latin America & the Caribbean (% of total merchandise imports)
This statistics in other country:
AfghanistanAlbaniaAlgeriaAngolaAntigua and BarbudaArab WorldArgentinaArmeniaArubaAustraliaAustriaAzerbaijanBahamas, TheBahrainBangladeshBarbadosBelarusBelgiumBelizeBeninBermudaBoliviaBrazilBrunei DarussalamBulgariaBurkina FasoCabo VerdeCambodiaCameroonCanadaCaribbean small statesCentral African RepublicCentral Europe and the BalticsChileChinaColombiaCongo, Dem. Rep.Congo, Rep.Costa RicaCote d'IvoireCroatiaCubaCyprusCzech RepublicDenmarkDominicaDominican RepublicEarly-demographic dividendEast Asia & PacificEast Asia & Pacific (excluding high income)East Asia & Pacific (IDA & IBRD countries)EcuadorEgypt, Arab Rep.El SalvadorEstoniaEthiopiaEuro areaEurope & Central AsiaEurope & Central Asia (excluding high income)Europe & Central Asia (IDA & IBRD countries)European UnionFaroe IslandsFijiFinlandFragile and conflict affected situationsFranceFrench PolynesiaGabonGambia, TheGeorgiaGermanyGhanaGibraltarGreeceGreenlandGrenadaGuatemalaGuineaGuyanaHaitiHeavily indebted poor countries (HIPC)High incomeHondurasHong Kong SAR, ChinaHungaryIBRD onlyIcelandIDA & IBRD totalIDA blendIDA onlyIDA totalIndiaIndonesiaIran, Islamic Rep.IraqIrelandIsraelItalyJamaicaJapanJordanKazakhstanKenyaKorea, Dem. People’s Rep.Korea, Rep.KuwaitKyrgyz RepublicLate-demographic dividendLatin America & Caribbean Latin America & Caribbean (excluding high income)Latin America & the Caribbean (IDA & IBRD countries)LatviaLeast developed countries: UN classificationLebanonLiberiaLibyaLithuaniaLow & middle incomeLow incomeLower middle incomeLuxembourgMacao SAR, ChinaMacedonia, FYRMadagascarMalawiMalaysiaMaldivesMaliMaltaMauritaniaMauritiusMexicoMiddle East & North AfricaMiddle East & North Africa (excluding high income)Middle East & North Africa (IDA & IBRD countries)Middle incomeMoldovaMongoliaMontenegroMoroccoMozambiqueNetherlandsNew CaledoniaNew ZealandNicaraguaNigerNigeriaNorth AmericaNorwayOECD membersOmanOther small statesPacific island small statesPakistanPanamaPapua New GuineaParaguayPeruPhilippinesPolandPortugalPost-demographic dividendPre-demographic dividendQatarRomaniaRussian FederationSaudi ArabiaSenegalSerbiaSierra LeoneSingaporeSlovak RepublicSloveniaSmall statesSomaliaSouth AfricaSouth AsiaSouth Asia (IDA & IBRD)SpainSri LankaSt. Kitts and NevisSt. LuciaSt. Vincent and the GrenadinesSub-Saharan Africa Sub-Saharan Africa (excluding high income)Sub-Saharan Africa (IDA & IBRD countries)SudanSurinameSwedenSwitzerlandSyrian Arab RepublicTanzaniaThailandTogoTrinidad and TobagoTunisiaTurkeyUgandaUkraineUnited Arab EmiratesUnited KingdomUnited StatesUpper middle incomeUruguayVenezuela, RBVietnamWorldYemen, Rep.ZambiaZimbabwe Timeline:
This timeline shows a graph from 1961 to 2015 of Brazil. No data until 1960. Number of actual observations by date: 55.
Source name:
World Development Indicators
Source organization:
World Bank staff estimates based data from International Monetary Fund's Direction of Trade database.
Categories, topics:
Private Sector, Trade
Last updated:
apr 23, 2017
Indicators value changes by year
At the date of observation
Value
Absolute change
Change from previous value
jan 1, 1961
0.707
+0.707
0.0%
jan 1, 1962
0.518
-0.189
-26.78%
jan 1, 1963
1.824
+1.306
252.18%
jan 1, 1964
2.392
+0.569
31.2%
jan 1, 1965
1.983
-0.41
-17.12%
jan 1, 1966
2.126
+0.143
7.2%
jan 1, 1967
1.637
-0.489
-23.01%
jan 1, 1968
1.82
+0.184
11.21%
jan 1, 1969
2.09
+0.27
14.82%
jan 1, 1970
1.769
-0.321
-15.35%
jan 1, 1971
1.598
-0.171
-9.65%
jan 1, 1972
1.985
+0.387
24.22%
jan 1, 1973
2.306
+0.321
16.17%
jan 1, 1974
2.431
+0.125
5.42%
jan 1, 1975
1.808
-0.624
-25.65%
jan 1, 1976
2.039
+0.232
12.81%
jan 1, 1977
2.771
+0.732
35.89%
jan 1, 1978
3.039
+0.268
9.67%
jan 1, 1979
2.859
-0.18
-5.93%
jan 1, 1980
3.223
+0.364
12.71%
jan 1, 1981
3.449
+0.226
7.02%
jan 1, 1982
5.089
+1.64
47.57%
jan 1, 1983
6.728
+1.639
32.21%
jan 1, 1984
5.837
-0.891
-13.25%
jan 1, 1985
5.485
-0.352
-6.02%
jan 1, 1986
4.273
-1.213
-22.11%
jan 1, 1987
3.52
-0.753
-17.62%
jan 1, 1988
3.548
+0.028
0.79%
jan 1, 1989
2.906
-0.642
-18.09%
jan 1, 1990
4.927
+2.021
69.53%
jan 1, 1991
4.091
-0.836
-16.97%
jan 1, 1992
3.758
-0.333
-8.13%
jan 1, 1993
4.462
+0.704
18.73%
jan 1, 1994
3.752
-0.71
-15.9%
jan 1, 1995
3.277
-0.475
-12.67%
jan 1, 1996
3.727
+0.45
13.72%
jan 1, 1997
3.888
+0.161
4.33%
jan 1, 1998
3.634
-0.254
-6.53%
jan 1, 1999
3.024
-0.61
-16.79%
jan 1, 2000
2.684
-0.34
-11.24%
jan 1, 2001
3.49
+0.806
30.04%
jan 1, 2002
3.158
-0.333
-9.54%
jan 1, 2003
3.731
+0.574
18.17%
jan 1, 2004
4.045
+0.313
8.4%
jan 1, 2005
3.917
-0.127
-3.15%
jan 1, 2006
4.08
+0.163
4.16%
jan 1, 2007
4.738
+0.658
16.13%
jan 1, 2008
4.796
+0.058
1.22%
jan 1, 2009
5.095
+0.298
6.22%
jan 1, 2010
4.944
-0.15
-2.95%
jan 1, 2011
5.103
+0.159
3.21%
jan 1, 2012
5.382
+0.279
5.46%
jan 1, 2013
6.21
+0.828
15.39%
jan 1, 2014
6.161
-0.049
-0.79%
jan 1, 2015
6.286
+0.124
2.02%
Ranking of countries by current statistics by years


Comments: