29
/
en
AIzaSyAYiBZKx7MnpbEhh9jyipgxe19OcubqV5w
April 1, 2024
74170
Austria
AUT
true
2
1
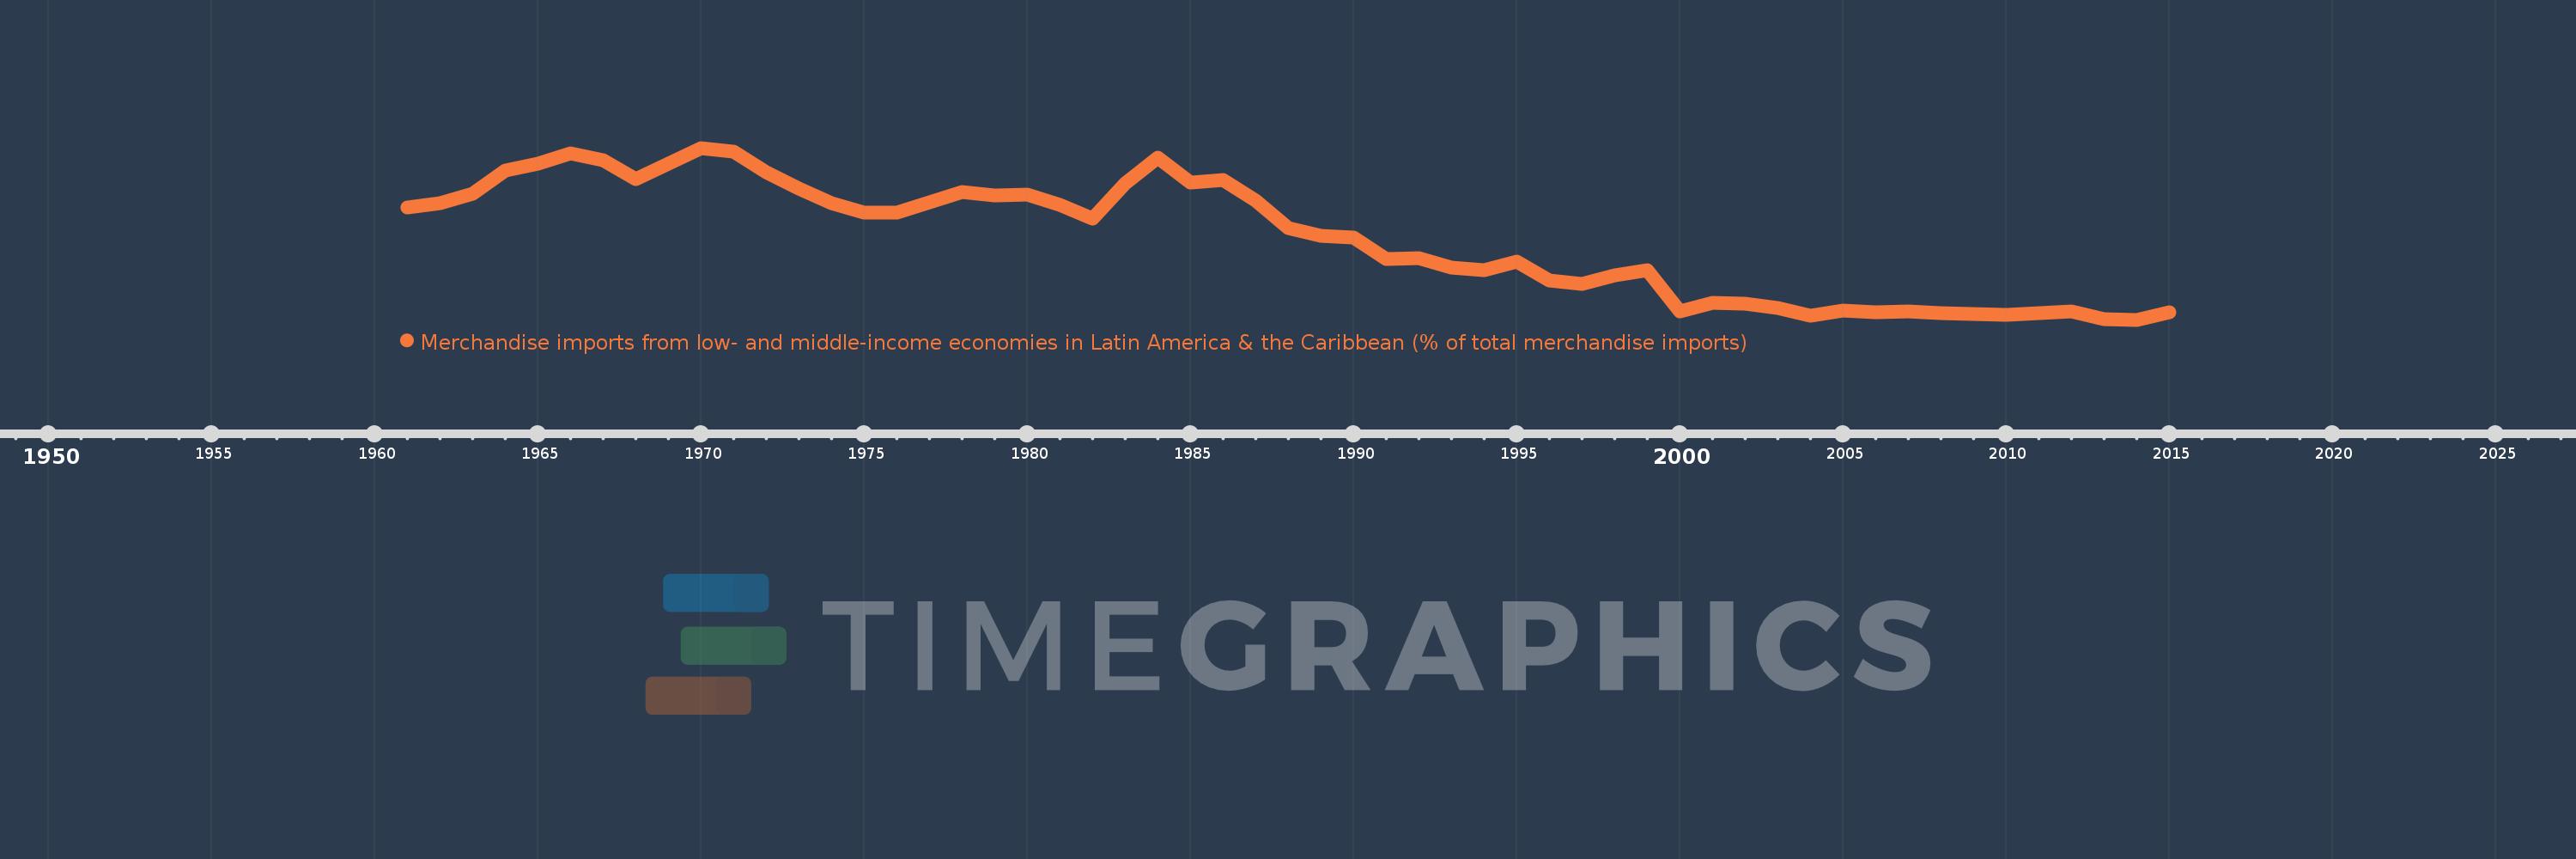
Merchandise imports from low- and middle-income economies in Latin America & the Caribbean (% of total merchandise imports)
2015,2014,2013,2012,2011,2010,2009,2008,2007,2006,2005,2004,2003,2002,2001,2000,1999,1998,1997,1996,1995,1994,1993,1992,1991,1990,1989,1988,1987,1986,1985,1984,1983,1982,1981,1980,1979,1978,1977,1976,1975,1974,1973,1972,1971,1970,1969,1968,1967,1966,1965,1964,1963,1962,1961
This statistics in other country:
AfghanistanAlbaniaAlgeriaAngolaAntigua and BarbudaArab WorldArgentinaArmeniaArubaAustraliaAustriaAzerbaijanBahamas, TheBahrainBangladeshBarbadosBelarusBelgiumBelizeBeninBermudaBoliviaBrazilBrunei DarussalamBulgariaBurkina FasoCabo VerdeCambodiaCameroonCanadaCaribbean small statesCentral African RepublicCentral Europe and the BalticsChileChinaColombiaCongo, Dem. Rep.Congo, Rep.Costa RicaCote d'IvoireCroatiaCubaCyprusCzech RepublicDenmarkDominicaDominican RepublicEarly-demographic dividendEast Asia & PacificEast Asia & Pacific (excluding high income)East Asia & Pacific (IDA & IBRD countries)EcuadorEgypt, Arab Rep.El SalvadorEstoniaEthiopiaEuro areaEurope & Central AsiaEurope & Central Asia (excluding high income)Europe & Central Asia (IDA & IBRD countries)European UnionFaroe IslandsFijiFinlandFragile and conflict affected situationsFranceFrench PolynesiaGabonGambia, TheGeorgiaGermanyGhanaGibraltarGreeceGreenlandGrenadaGuatemalaGuineaGuyanaHaitiHeavily indebted poor countries (HIPC)High incomeHondurasHong Kong SAR, ChinaHungaryIBRD onlyIcelandIDA & IBRD totalIDA blendIDA onlyIDA totalIndiaIndonesiaIran, Islamic Rep.IraqIrelandIsraelItalyJamaicaJapanJordanKazakhstanKenyaKorea, Dem. People’s Rep.Korea, Rep.KuwaitKyrgyz RepublicLate-demographic dividendLatin America & Caribbean Latin America & Caribbean (excluding high income)Latin America & the Caribbean (IDA & IBRD countries)LatviaLeast developed countries: UN classificationLebanonLiberiaLibyaLithuaniaLow & middle incomeLow incomeLower middle incomeLuxembourgMacao SAR, ChinaMacedonia, FYRMadagascarMalawiMalaysiaMaldivesMaliMaltaMauritaniaMauritiusMexicoMiddle East & North AfricaMiddle East & North Africa (excluding high income)Middle East & North Africa (IDA & IBRD countries)Middle incomeMoldovaMongoliaMontenegroMoroccoMozambiqueNetherlandsNew CaledoniaNew ZealandNicaraguaNigerNigeriaNorth AmericaNorwayOECD membersOmanOther small statesPacific island small statesPakistanPanamaPapua New GuineaParaguayPeruPhilippinesPolandPortugalPost-demographic dividendPre-demographic dividendQatarRomaniaRussian FederationSaudi ArabiaSenegalSerbiaSierra LeoneSingaporeSlovak RepublicSloveniaSmall statesSomaliaSouth AfricaSouth AsiaSouth Asia (IDA & IBRD)SpainSri LankaSt. Kitts and NevisSt. LuciaSt. Vincent and the GrenadinesSub-Saharan Africa Sub-Saharan Africa (excluding high income)Sub-Saharan Africa (IDA & IBRD countries)SudanSurinameSwedenSwitzerlandSyrian Arab RepublicTanzaniaThailandTogoTrinidad and TobagoTunisiaTurkeyUgandaUkraineUnited Arab EmiratesUnited KingdomUnited StatesUpper middle incomeUruguayVenezuela, RBVietnamWorldYemen, Rep.ZambiaZimbabwe Timeline:
This timeline shows a graph from 1961 to 2015 of Austria. No data until 1960. Number of actual observations by date: 55.
Source name:
World Development Indicators
Source organization:
World Bank staff estimates based data from International Monetary Fund's Direction of Trade database.
Categories, topics:
Private Sector, Trade
Last updated:
apr 23, 2017
Indicators value changes by year
At the date of observation
Value
Absolute change
Change from previous value
jan 1, 1961
1.469
+1.469
0.0%
jan 1, 1962
1.523
+0.054
3.68%
jan 1, 1963
1.632
+0.108
7.11%
jan 1, 1964
1.903
+0.272
16.66%
jan 1, 1965
1.982
+0.079
4.15%
jan 1, 1966
2.101
+0.119
5.99%
jan 1, 1967
2.025
-0.076
-3.64%
jan 1, 1968
1.797
-0.228
-11.24%
jan 1, 1969
1.978
+0.181
10.08%
jan 1, 1970
2.163
+0.184
9.32%
jan 1, 1971
2.122
-0.041
-1.88%
jan 1, 1972
1.882
-0.24
-11.31%
jan 1, 1973
1.691
-0.191
-10.16%
jan 1, 1974
1.519
-0.172
-10.15%
jan 1, 1975
1.415
-0.104
-6.88%
jan 1, 1976
1.407
-0.008
-0.54%
jan 1, 1977
1.535
+0.128
9.11%
jan 1, 1978
1.654
+0.119
7.72%
jan 1, 1979
1.612
-0.042
-2.53%
jan 1, 1980
1.619
+0.008
0.47%
jan 1, 1981
1.496
-0.123
-7.62%
jan 1, 1982
1.343
-0.153
-10.2%
jan 1, 1983
1.749
+0.406
30.2%
jan 1, 1984
2.052
+0.303
17.31%
jan 1, 1985
1.756
-0.296
-14.41%
jan 1, 1986
1.79
+0.034
1.92%
jan 1, 1987
1.554
-0.236
-13.19%
jan 1, 1988
1.227
-0.327
-21.03%
jan 1, 1989
1.14
-0.087
-7.06%
jan 1, 1990
1.122
-0.019
-1.64%
jan 1, 1991
0.868
-0.254
-22.66%
jan 1, 1992
0.879
+0.011
1.32%
jan 1, 1993
0.771
-0.109
-12.35%
jan 1, 1994
0.739
-0.031
-4.07%
jan 1, 1995
0.839
+0.1
13.57%
jan 1, 1996
0.62
-0.219
-26.11%
jan 1, 1997
0.582
-0.038
-6.2%
jan 1, 1998
0.677
+0.095
16.4%
jan 1, 1999
0.737
+0.06
8.86%
jan 1, 2000
0.263
-0.474
-64.31%
jan 1, 2001
0.364
+0.101
38.52%
jan 1, 2002
0.351
-0.013
-3.58%
jan 1, 2003
0.301
-0.05
-14.26%
jan 1, 2004
0.213
-0.088
-29.19%
jan 1, 2005
0.274
+0.061
28.37%
jan 1, 2006
0.255
-0.019
-6.93%
jan 1, 2007
0.261
+0.006
2.31%
jan 1, 2008
0.239
-0.022
-8.54%
jan 1, 2009
0.23
-0.009
-3.68%
jan 1, 2010
0.219
-0.011
-4.64%
jan 1, 2011
0.245
+0.025
11.61%
jan 1, 2012
0.266
+0.021
8.67%
jan 1, 2013
0.175
-0.091
-34.3%
jan 1, 2014
0.165
-0.009
-5.22%
jan 1, 2015
0.248
+0.083
50.16%
Ranking of countries by current statistics by years


Comments: