29
/
en
AIzaSyAYiBZKx7MnpbEhh9jyipgxe19OcubqV5w
April 1, 2024
162846
Jamaica
JAM
true
2
1
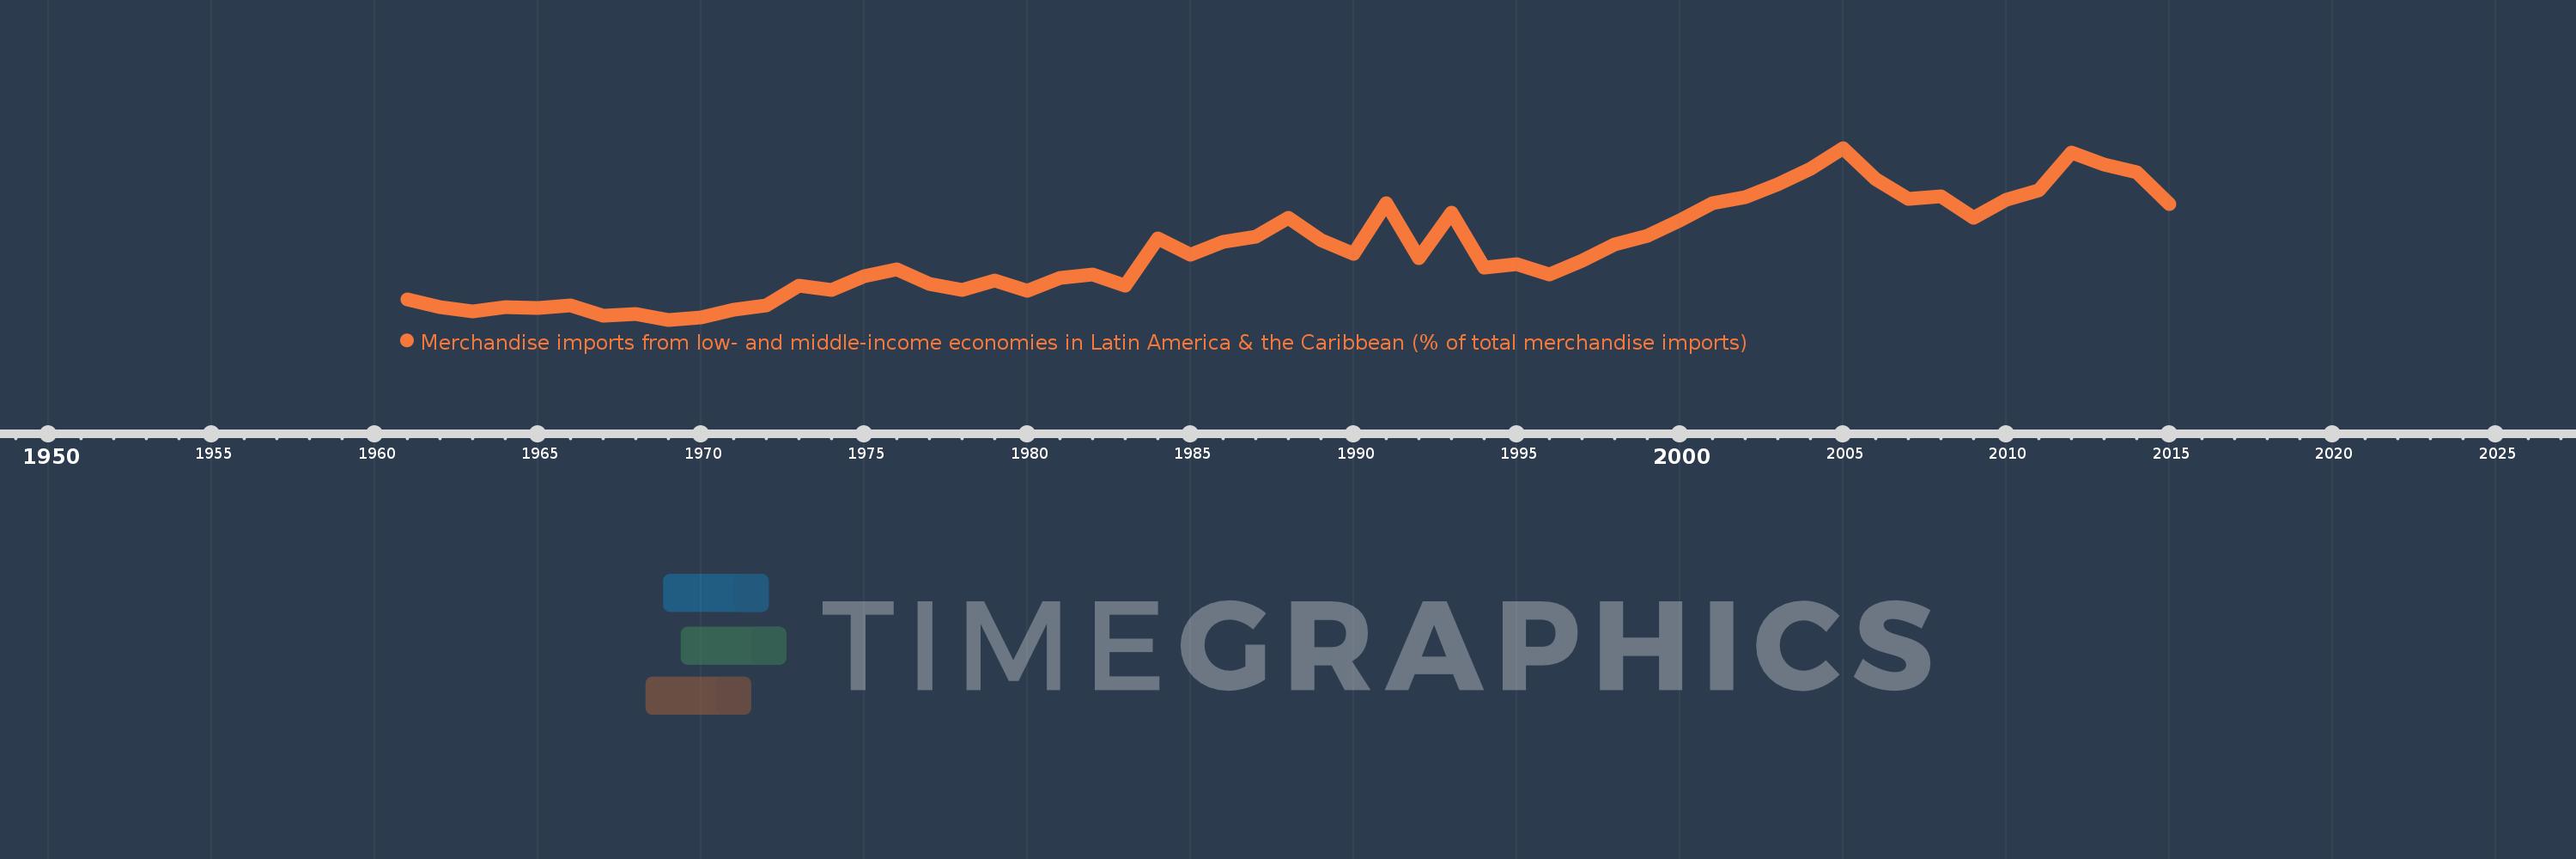
Merchandise imports from low- and middle-income economies in Latin America & the Caribbean (% of total merchandise imports)
2015,2014,2013,2012,2011,2010,2009,2008,2007,2006,2005,2004,2003,2002,2001,2000,1999,1998,1997,1996,1995,1994,1993,1992,1991,1990,1989,1988,1987,1986,1985,1984,1983,1982,1981,1980,1979,1978,1977,1976,1975,1974,1973,1972,1971,1970,1969,1968,1967,1966,1965,1964,1963,1962,1961
This statistics in other country:
AfghanistanAlbaniaAlgeriaAngolaAntigua and BarbudaArab WorldArgentinaArmeniaArubaAustraliaAustriaAzerbaijanBahamas, TheBahrainBangladeshBarbadosBelarusBelgiumBelizeBeninBermudaBoliviaBrazilBrunei DarussalamBulgariaBurkina FasoCabo VerdeCambodiaCameroonCanadaCaribbean small statesCentral African RepublicCentral Europe and the BalticsChileChinaColombiaCongo, Dem. Rep.Congo, Rep.Costa RicaCote d'IvoireCroatiaCubaCyprusCzech RepublicDenmarkDominicaDominican RepublicEarly-demographic dividendEast Asia & PacificEast Asia & Pacific (excluding high income)East Asia & Pacific (IDA & IBRD countries)EcuadorEgypt, Arab Rep.El SalvadorEstoniaEthiopiaEuro areaEurope & Central AsiaEurope & Central Asia (excluding high income)Europe & Central Asia (IDA & IBRD countries)European UnionFaroe IslandsFijiFinlandFragile and conflict affected situationsFranceFrench PolynesiaGabonGambia, TheGeorgiaGermanyGhanaGibraltarGreeceGreenlandGrenadaGuatemalaGuineaGuyanaHaitiHeavily indebted poor countries (HIPC)High incomeHondurasHong Kong SAR, ChinaHungaryIBRD onlyIcelandIDA & IBRD totalIDA blendIDA onlyIDA totalIndiaIndonesiaIran, Islamic Rep.IraqIrelandIsraelItalyJamaicaJapanJordanKazakhstanKenyaKorea, Dem. People’s Rep.Korea, Rep.KuwaitKyrgyz RepublicLate-demographic dividendLatin America & Caribbean Latin America & Caribbean (excluding high income)Latin America & the Caribbean (IDA & IBRD countries)LatviaLeast developed countries: UN classificationLebanonLiberiaLibyaLithuaniaLow & middle incomeLow incomeLower middle incomeLuxembourgMacao SAR, ChinaMacedonia, FYRMadagascarMalawiMalaysiaMaldivesMaliMaltaMauritaniaMauritiusMexicoMiddle East & North AfricaMiddle East & North Africa (excluding high income)Middle East & North Africa (IDA & IBRD countries)Middle incomeMoldovaMongoliaMontenegroMoroccoMozambiqueNetherlandsNew CaledoniaNew ZealandNicaraguaNigerNigeriaNorth AmericaNorwayOECD membersOmanOther small statesPacific island small statesPakistanPanamaPapua New GuineaParaguayPeruPhilippinesPolandPortugalPost-demographic dividendPre-demographic dividendQatarRomaniaRussian FederationSaudi ArabiaSenegalSerbiaSierra LeoneSingaporeSlovak RepublicSloveniaSmall statesSomaliaSouth AfricaSouth AsiaSouth Asia (IDA & IBRD)SpainSri LankaSt. Kitts and NevisSt. LuciaSt. Vincent and the GrenadinesSub-Saharan Africa Sub-Saharan Africa (excluding high income)Sub-Saharan Africa (IDA & IBRD countries)SudanSurinameSwedenSwitzerlandSyrian Arab RepublicTanzaniaThailandTogoTrinidad and TobagoTunisiaTurkeyUgandaUkraineUnited Arab EmiratesUnited KingdomUnited StatesUpper middle incomeUruguayVenezuela, RBVietnamWorldYemen, Rep.ZambiaZimbabwe Timeline:
This timeline shows a graph from 1961 to 2015 of Jamaica. No data until 1960. Number of actual observations by date: 55.
Source name:
World Development Indicators
Source organization:
World Bank staff estimates based data from International Monetary Fund's Direction of Trade database.
Categories, topics:
Private Sector, Trade
Last updated:
apr 23, 2017
Indicators value changes by year
Maximum:
15.662
jan 1, 2005
At the date of observation
Value
Absolute change
Change from previous value
jan 1, 1962
2.471
-0.629
-20.29%
jan 1, 1963
2.153
-0.318
-12.87%
jan 1, 1964
2.486
+0.332
15.42%
jan 1, 1965
2.414
-0.072
-2.88%
jan 1, 1966
2.646
+0.232
9.61%
jan 1, 1967
1.805
-0.841
-31.77%
jan 1, 1968
1.923
+0.118
6.53%
jan 1, 1969
1.436
-0.487
-25.33%
jan 1, 1970
1.617
+0.181
12.62%
jan 1, 1971
2.253
+0.636
39.33%
jan 1, 1972
2.602
+0.349
15.47%
jan 1, 1973
4.269
+1.667
64.09%
jan 1, 1974
3.872
-0.397
-9.31%
jan 1, 1975
5.056
+1.184
30.58%
jan 1, 1976
5.578
+0.522
10.32%
jan 1, 1977
4.434
-1.144
-20.51%
jan 1, 1978
3.878
-0.556
-12.53%
jan 1, 1979
4.72
+0.842
21.71%
jan 1, 1980
3.867
-0.854
-18.08%
jan 1, 1981
4.923
+1.057
27.33%
jan 1, 1982
5.179
+0.255
5.19%
jan 1, 1983
4.266
-0.912
-17.62%
jan 1, 1984
8.153
+3.887
91.11%
jan 1, 1985
6.817
-1.336
-16.39%
jan 1, 1986
7.923
+1.106
16.23%
jan 1, 1987
8.31
+0.387
4.89%
jan 1, 1988
9.856
+1.546
18.61%
jan 1, 1989
7.997
-1.859
-18.86%
jan 1, 1990
6.873
-1.125
-14.06%
jan 1, 1991
11.091
+4.218
61.37%
jan 1, 1992
6.538
-4.553
-41.05%
jan 1, 1993
10.319
+3.781
57.84%
jan 1, 1994
5.766
-4.553
-44.12%
jan 1, 1995
6.058
+0.292
5.06%
jan 1, 1996
5.182
-0.876
-14.46%
jan 1, 1997
6.32
+1.138
21.96%
jan 1, 1998
7.674
+1.354
21.42%
jan 1, 1999
8.411
+0.737
9.61%
jan 1, 2000
9.644
+1.233
14.66%
jan 1, 2001
11.105
+1.461
15.15%
jan 1, 2002
11.616
+0.512
4.61%
jan 1, 2003
12.688
+1.072
9.22%
jan 1, 2004
13.921
+1.233
9.72%
jan 1, 2005
15.662
+1.741
12.51%
jan 1, 2006
13.084
-2.578
-16.46%
jan 1, 2007
11.437
-1.648
-12.59%
jan 1, 2008
11.634
+0.197
1.72%
jan 1, 2009
9.867
-1.766
-15.18%
jan 1, 2010
11.344
+1.476
14.96%
jan 1, 2011
12.137
+0.793
6.99%
jan 1, 2012
15.29
+3.153
25.98%
jan 1, 2013
14.267
-1.023
-6.69%
jan 1, 2014
13.625
-0.642
-4.5%
jan 1, 2015
11.027
-2.598
-19.07%
Ranking of countries by current statistics by years


Comments: