29
/
en
AIzaSyAYiBZKx7MnpbEhh9jyipgxe19OcubqV5w
April 1, 2024
249019
Sri Lanka
LKA
true
2
1
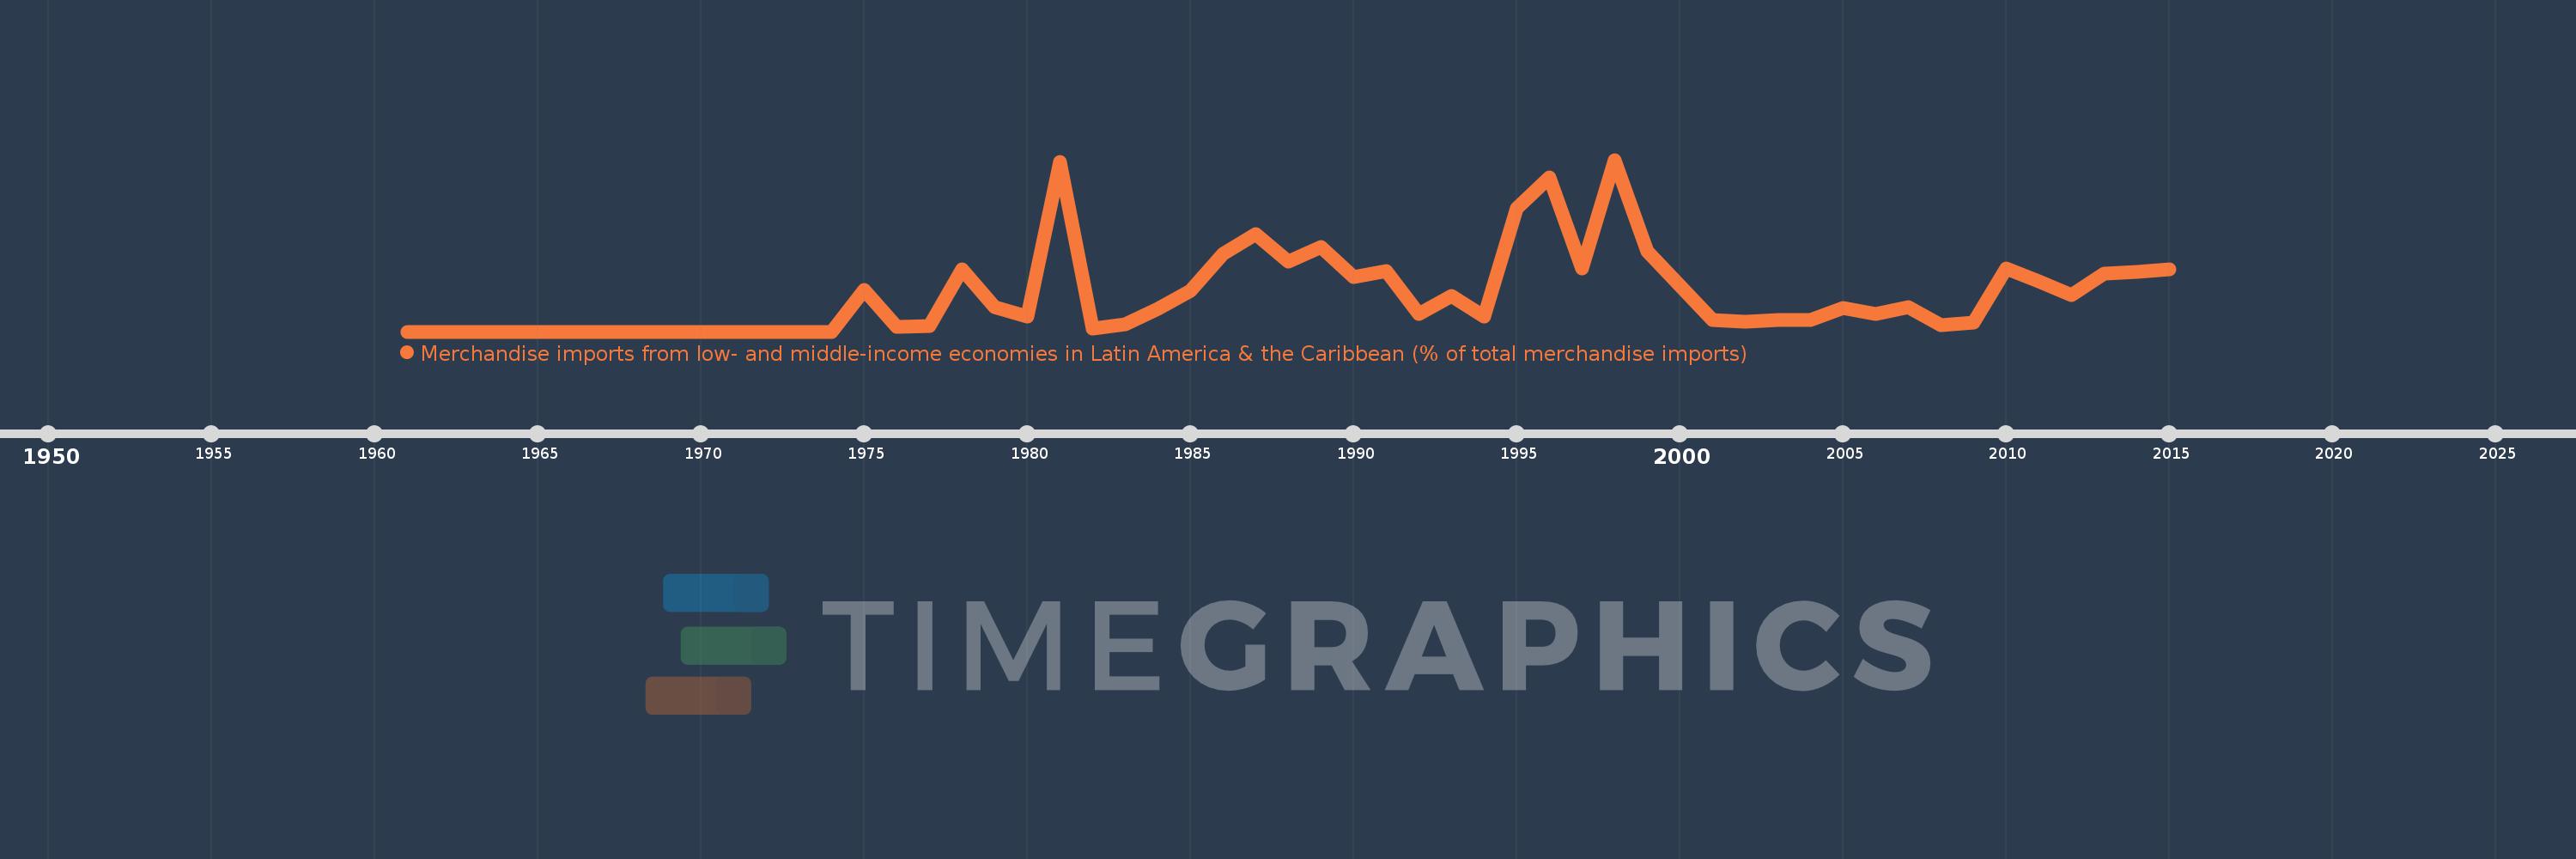
Merchandise imports from low- and middle-income economies in Latin America & the Caribbean (% of total merchandise imports)
2015,2014,2013,2012,2011,2010,2009,2008,2007,2006,2005,2004,2003,2002,2001,2000,1999,1998,1997,1996,1995,1994,1993,1992,1991,1990,1989,1988,1987,1986,1985,1984,1983,1982,1981,1980,1979,1978,1977,1976,1975,1974,1973,1972,1971,1970,1969,1968,1967,1966,1965,1964,1963,1962,1961
This statistics in other country:
AfghanistanAlbaniaAlgeriaAngolaAntigua and BarbudaArab WorldArgentinaArmeniaArubaAustraliaAustriaAzerbaijanBahamas, TheBahrainBangladeshBarbadosBelarusBelgiumBelizeBeninBermudaBoliviaBrazilBrunei DarussalamBulgariaBurkina FasoCabo VerdeCambodiaCameroonCanadaCaribbean small statesCentral African RepublicCentral Europe and the BalticsChileChinaColombiaCongo, Dem. Rep.Congo, Rep.Costa RicaCote d'IvoireCroatiaCubaCyprusCzech RepublicDenmarkDominicaDominican RepublicEarly-demographic dividendEast Asia & PacificEast Asia & Pacific (excluding high income)East Asia & Pacific (IDA & IBRD countries)EcuadorEgypt, Arab Rep.El SalvadorEstoniaEthiopiaEuro areaEurope & Central AsiaEurope & Central Asia (excluding high income)Europe & Central Asia (IDA & IBRD countries)European UnionFaroe IslandsFijiFinlandFragile and conflict affected situationsFranceFrench PolynesiaGabonGambia, TheGeorgiaGermanyGhanaGibraltarGreeceGreenlandGrenadaGuatemalaGuineaGuyanaHaitiHeavily indebted poor countries (HIPC)High incomeHondurasHong Kong SAR, ChinaHungaryIBRD onlyIcelandIDA & IBRD totalIDA blendIDA onlyIDA totalIndiaIndonesiaIran, Islamic Rep.IraqIrelandIsraelItalyJamaicaJapanJordanKazakhstanKenyaKorea, Dem. People’s Rep.Korea, Rep.KuwaitKyrgyz RepublicLate-demographic dividendLatin America & Caribbean Latin America & Caribbean (excluding high income)Latin America & the Caribbean (IDA & IBRD countries)LatviaLeast developed countries: UN classificationLebanonLiberiaLibyaLithuaniaLow & middle incomeLow incomeLower middle incomeLuxembourgMacao SAR, ChinaMacedonia, FYRMadagascarMalawiMalaysiaMaldivesMaliMaltaMauritaniaMauritiusMexicoMiddle East & North AfricaMiddle East & North Africa (excluding high income)Middle East & North Africa (IDA & IBRD countries)Middle incomeMoldovaMongoliaMontenegroMoroccoMozambiqueNetherlandsNew CaledoniaNew ZealandNicaraguaNigerNigeriaNorth AmericaNorwayOECD membersOmanOther small statesPacific island small statesPakistanPanamaPapua New GuineaParaguayPeruPhilippinesPolandPortugalPost-demographic dividendPre-demographic dividendQatarRomaniaRussian FederationSaudi ArabiaSenegalSerbiaSierra LeoneSingaporeSlovak RepublicSloveniaSmall statesSomaliaSouth AfricaSouth AsiaSouth Asia (IDA & IBRD)SpainSri LankaSt. Kitts and NevisSt. LuciaSt. Vincent and the GrenadinesSub-Saharan Africa Sub-Saharan Africa (excluding high income)Sub-Saharan Africa (IDA & IBRD countries)SudanSurinameSwedenSwitzerlandSyrian Arab RepublicTanzaniaThailandTogoTrinidad and TobagoTunisiaTurkeyUgandaUkraineUnited Arab EmiratesUnited KingdomUnited StatesUpper middle incomeUruguayVenezuela, RBVietnamWorldYemen, Rep.ZambiaZimbabwe Timeline:
This timeline shows a graph from 1961 to 2015 of Sri Lanka. No data until 1960. Number of actual observations by date: 55.
Source name:
World Development Indicators
Source organization:
World Bank staff estimates based data from International Monetary Fund's Direction of Trade database.
Categories, topics:
Private Sector, Trade
Last updated:
apr 23, 2017
Indicators value changes by year
At the date of observation
Value
Absolute change
Change from previous value
jan 1, 1976
0.071
-0.549
-88.54%
jan 1, 1977
0.084
+0.013
17.72%
jan 1, 1978
0.917
+0.833
996.92%
jan 1, 1979
0.359
-0.558
-60.84%
jan 1, 1980
0.224
-0.135
-37.6%
jan 1, 1981
2.511
+2.287
1.02K%
jan 1, 1982
0.049
-2.462
-98.06%
jan 1, 1983
0.107
+0.058
118.76%
jan 1, 1984
0.341
+0.235
220.1%
jan 1, 1985
0.604
+0.262
76.88%
jan 1, 1986
1.148
+0.545
90.19%
jan 1, 1987
1.446
+0.297
25.88%
jan 1, 1988
1.033
-0.412
-28.51%
jan 1, 1989
1.244
+0.21
20.32%
jan 1, 1990
0.811
-0.433
-34.78%
jan 1, 1991
0.899
+0.088
10.83%
jan 1, 1992
0.258
-0.64
-71.25%
jan 1, 1993
0.53
+0.271
105.0%
jan 1, 1994
0.227
-0.303
-57.13%
jan 1, 1995
1.819
+1.592
701.09%
jan 1, 1996
2.276
+0.457
25.11%
jan 1, 1997
0.928
-1.348
-59.22%
jan 1, 1998
2.537
+1.609
173.3%
jan 1, 1999
1.19
-1.347
-53.1%
jan 1, 2000
0.682
-0.508
-42.68%
jan 1, 2001
0.174
-0.508
-74.51%
jan 1, 2002
0.142
-0.032
-18.2%
jan 1, 2003
0.177
+0.035
24.73%
jan 1, 2004
0.169
-0.008
-4.67%
jan 1, 2005
0.345
+0.176
104.27%
jan 1, 2006
0.258
-0.087
-25.23%
jan 1, 2007
0.356
+0.098
38.01%
jan 1, 2008
0.094
-0.262
-73.61%
jan 1, 2009
0.135
+0.041
43.33%
jan 1, 2010
0.933
+0.798
592.16%
jan 1, 2011
0.746
-0.188
-20.11%
jan 1, 2012
0.545
-0.2
-26.88%
jan 1, 2013
0.856
+0.311
57.04%
jan 1, 2014
0.886
+0.03
3.48%
jan 1, 2015
0.917
+0.031
3.46%
Ranking of countries by current statistics by years


Comments: