29
/
en
AIzaSyAYiBZKx7MnpbEhh9jyipgxe19OcubqV5w
April 1, 2024
139532
Germany
DEU
true
2
1
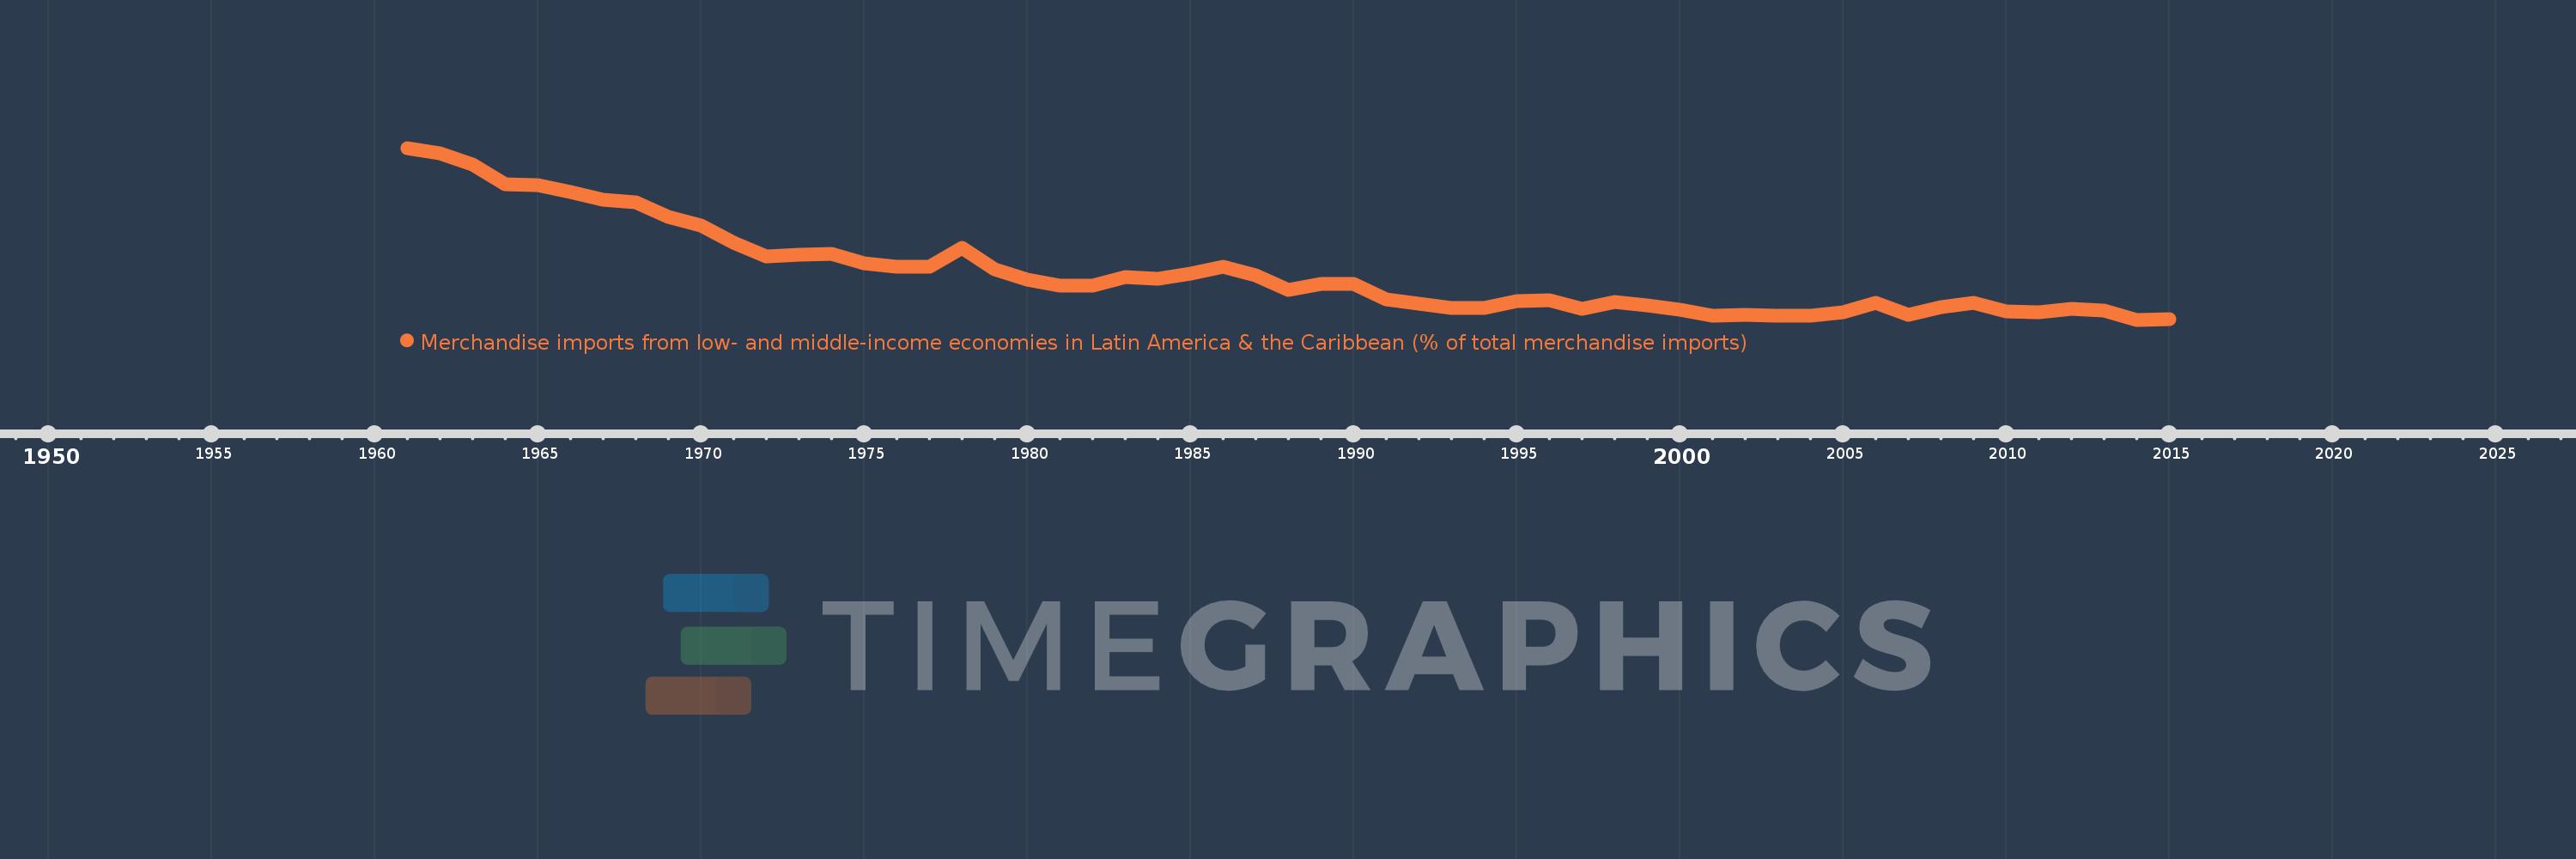
Merchandise imports from low- and middle-income economies in Latin America & the Caribbean (% of total merchandise imports)
2015,2014,2013,2012,2011,2010,2009,2008,2007,2006,2005,2004,2003,2002,2001,2000,1999,1998,1997,1996,1995,1994,1993,1992,1991,1990,1989,1988,1987,1986,1985,1984,1983,1982,1981,1980,1979,1978,1977,1976,1975,1974,1973,1972,1971,1970,1969,1968,1967,1966,1965,1964,1963,1962,1961
This statistics in other country:
AfghanistanAlbaniaAlgeriaAngolaAntigua and BarbudaArab WorldArgentinaArmeniaArubaAustraliaAustriaAzerbaijanBahamas, TheBahrainBangladeshBarbadosBelarusBelgiumBelizeBeninBermudaBoliviaBrazilBrunei DarussalamBulgariaBurkina FasoCabo VerdeCambodiaCameroonCanadaCaribbean small statesCentral African RepublicCentral Europe and the BalticsChileChinaColombiaCongo, Dem. Rep.Congo, Rep.Costa RicaCote d'IvoireCroatiaCubaCyprusCzech RepublicDenmarkDominicaDominican RepublicEarly-demographic dividendEast Asia & PacificEast Asia & Pacific (excluding high income)East Asia & Pacific (IDA & IBRD countries)EcuadorEgypt, Arab Rep.El SalvadorEstoniaEthiopiaEuro areaEurope & Central AsiaEurope & Central Asia (excluding high income)Europe & Central Asia (IDA & IBRD countries)European UnionFaroe IslandsFijiFinlandFragile and conflict affected situationsFranceFrench PolynesiaGabonGambia, TheGeorgiaGermanyGhanaGibraltarGreeceGreenlandGrenadaGuatemalaGuineaGuyanaHaitiHeavily indebted poor countries (HIPC)High incomeHondurasHong Kong SAR, ChinaHungaryIBRD onlyIcelandIDA & IBRD totalIDA blendIDA onlyIDA totalIndiaIndonesiaIran, Islamic Rep.IraqIrelandIsraelItalyJamaicaJapanJordanKazakhstanKenyaKorea, Dem. People’s Rep.Korea, Rep.KuwaitKyrgyz RepublicLate-demographic dividendLatin America & Caribbean Latin America & Caribbean (excluding high income)Latin America & the Caribbean (IDA & IBRD countries)LatviaLeast developed countries: UN classificationLebanonLiberiaLibyaLithuaniaLow & middle incomeLow incomeLower middle incomeLuxembourgMacao SAR, ChinaMacedonia, FYRMadagascarMalawiMalaysiaMaldivesMaliMaltaMauritaniaMauritiusMexicoMiddle East & North AfricaMiddle East & North Africa (excluding high income)Middle East & North Africa (IDA & IBRD countries)Middle incomeMoldovaMongoliaMontenegroMoroccoMozambiqueNetherlandsNew CaledoniaNew ZealandNicaraguaNigerNigeriaNorth AmericaNorwayOECD membersOmanOther small statesPacific island small statesPakistanPanamaPapua New GuineaParaguayPeruPhilippinesPolandPortugalPost-demographic dividendPre-demographic dividendQatarRomaniaRussian FederationSaudi ArabiaSenegalSerbiaSierra LeoneSingaporeSlovak RepublicSloveniaSmall statesSomaliaSouth AfricaSouth AsiaSouth Asia (IDA & IBRD)SpainSri LankaSt. Kitts and NevisSt. LuciaSt. Vincent and the GrenadinesSub-Saharan Africa Sub-Saharan Africa (excluding high income)Sub-Saharan Africa (IDA & IBRD countries)SudanSurinameSwedenSwitzerlandSyrian Arab RepublicTanzaniaThailandTogoTrinidad and TobagoTunisiaTurkeyUgandaUkraineUnited Arab EmiratesUnited KingdomUnited StatesUpper middle incomeUruguayVenezuela, RBVietnamWorldYemen, Rep.ZambiaZimbabwe Timeline:
This timeline shows a graph from 1961 to 2015 of Germany. No data until 1960. Number of actual observations by date: 55.
Source name:
World Development Indicators
Source organization:
World Bank staff estimates based data from International Monetary Fund's Direction of Trade database.
Categories, topics:
Private Sector, Trade
Last updated:
apr 23, 2017
Indicators value changes by year
At the date of observation
Value
Absolute change
Change from previous value
jan 1, 1961
5.133
+5.133
0.0%
jan 1, 1962
5.008
-0.125
-2.44%
jan 1, 1963
4.755
-0.253
-5.06%
jan 1, 1964
4.316
-0.439
-9.23%
jan 1, 1965
4.291
-0.025
-0.58%
jan 1, 1966
4.14
-0.151
-3.52%
jan 1, 1967
3.966
-0.174
-4.21%
jan 1, 1968
3.917
-0.048
-1.22%
jan 1, 1969
3.592
-0.326
-8.32%
jan 1, 1970
3.397
-0.194
-5.41%
jan 1, 1971
3.018
-0.38
-11.17%
jan 1, 1972
2.695
-0.323
-10.71%
jan 1, 1973
2.749
+0.054
2.01%
jan 1, 1974
2.756
+0.007
0.24%
jan 1, 1975
2.543
-0.212
-7.71%
jan 1, 1976
2.471
-0.072
-2.85%
jan 1, 1977
2.472
+0.002
0.06%
jan 1, 1978
2.888
+0.416
16.81%
jan 1, 1979
2.411
-0.477
-16.52%
jan 1, 1980
2.179
-0.231
-9.59%
jan 1, 1981
2.044
-0.136
-6.24%
jan 1, 1982
2.047
+0.004
0.18%
jan 1, 1983
2.24
+0.193
9.44%
jan 1, 1984
2.205
-0.036
-1.61%
jan 1, 1985
2.328
+0.124
5.61%
jan 1, 1986
2.481
+0.153
6.55%
jan 1, 1987
2.29
-0.191
-7.69%
jan 1, 1988
1.961
-0.329
-14.38%
jan 1, 1989
2.09
+0.129
6.58%
jan 1, 1990
2.082
-0.008
-0.39%
jan 1, 1991
1.742
-0.339
-16.3%
jan 1, 1992
1.649
-0.093
-5.37%
jan 1, 1993
1.549
-0.1
-6.07%
jan 1, 1994
1.552
+0.003
0.22%
jan 1, 1995
1.696
+0.144
9.26%
jan 1, 1996
1.726
+0.03
1.8%
jan 1, 1997
1.531
-0.195
-11.28%
jan 1, 1998
1.68
+0.149
9.72%
jan 1, 1999
1.605
-0.075
-4.46%
jan 1, 2000
1.519
-0.086
-5.39%
jan 1, 2001
1.384
-0.135
-8.87%
jan 1, 2002
1.397
+0.012
0.9%
jan 1, 2003
1.374
-0.022
-1.59%
jan 1, 2004
1.382
+0.008
0.58%
jan 1, 2005
1.461
+0.078
5.67%
jan 1, 2006
1.656
+0.195
13.38%
jan 1, 2007
1.387
-0.269
-16.23%
jan 1, 2008
1.573
+0.186
13.4%
jan 1, 2009
1.663
+0.089
5.68%
jan 1, 2010
1.481
-0.182
-10.94%
jan 1, 2011
1.455
-0.026
-1.75%
jan 1, 2012
1.531
+0.076
5.22%
jan 1, 2013
1.489
-0.042
-2.74%
jan 1, 2014
1.286
-0.203
-13.65%
jan 1, 2015
1.308
+0.023
1.76%
Ranking of countries by current statistics by years


Comments: