29
/
en
AIzaSyAYiBZKx7MnpbEhh9jyipgxe19OcubqV5w
April 1, 2024
36774
IBRD only
IBD
false
2
1
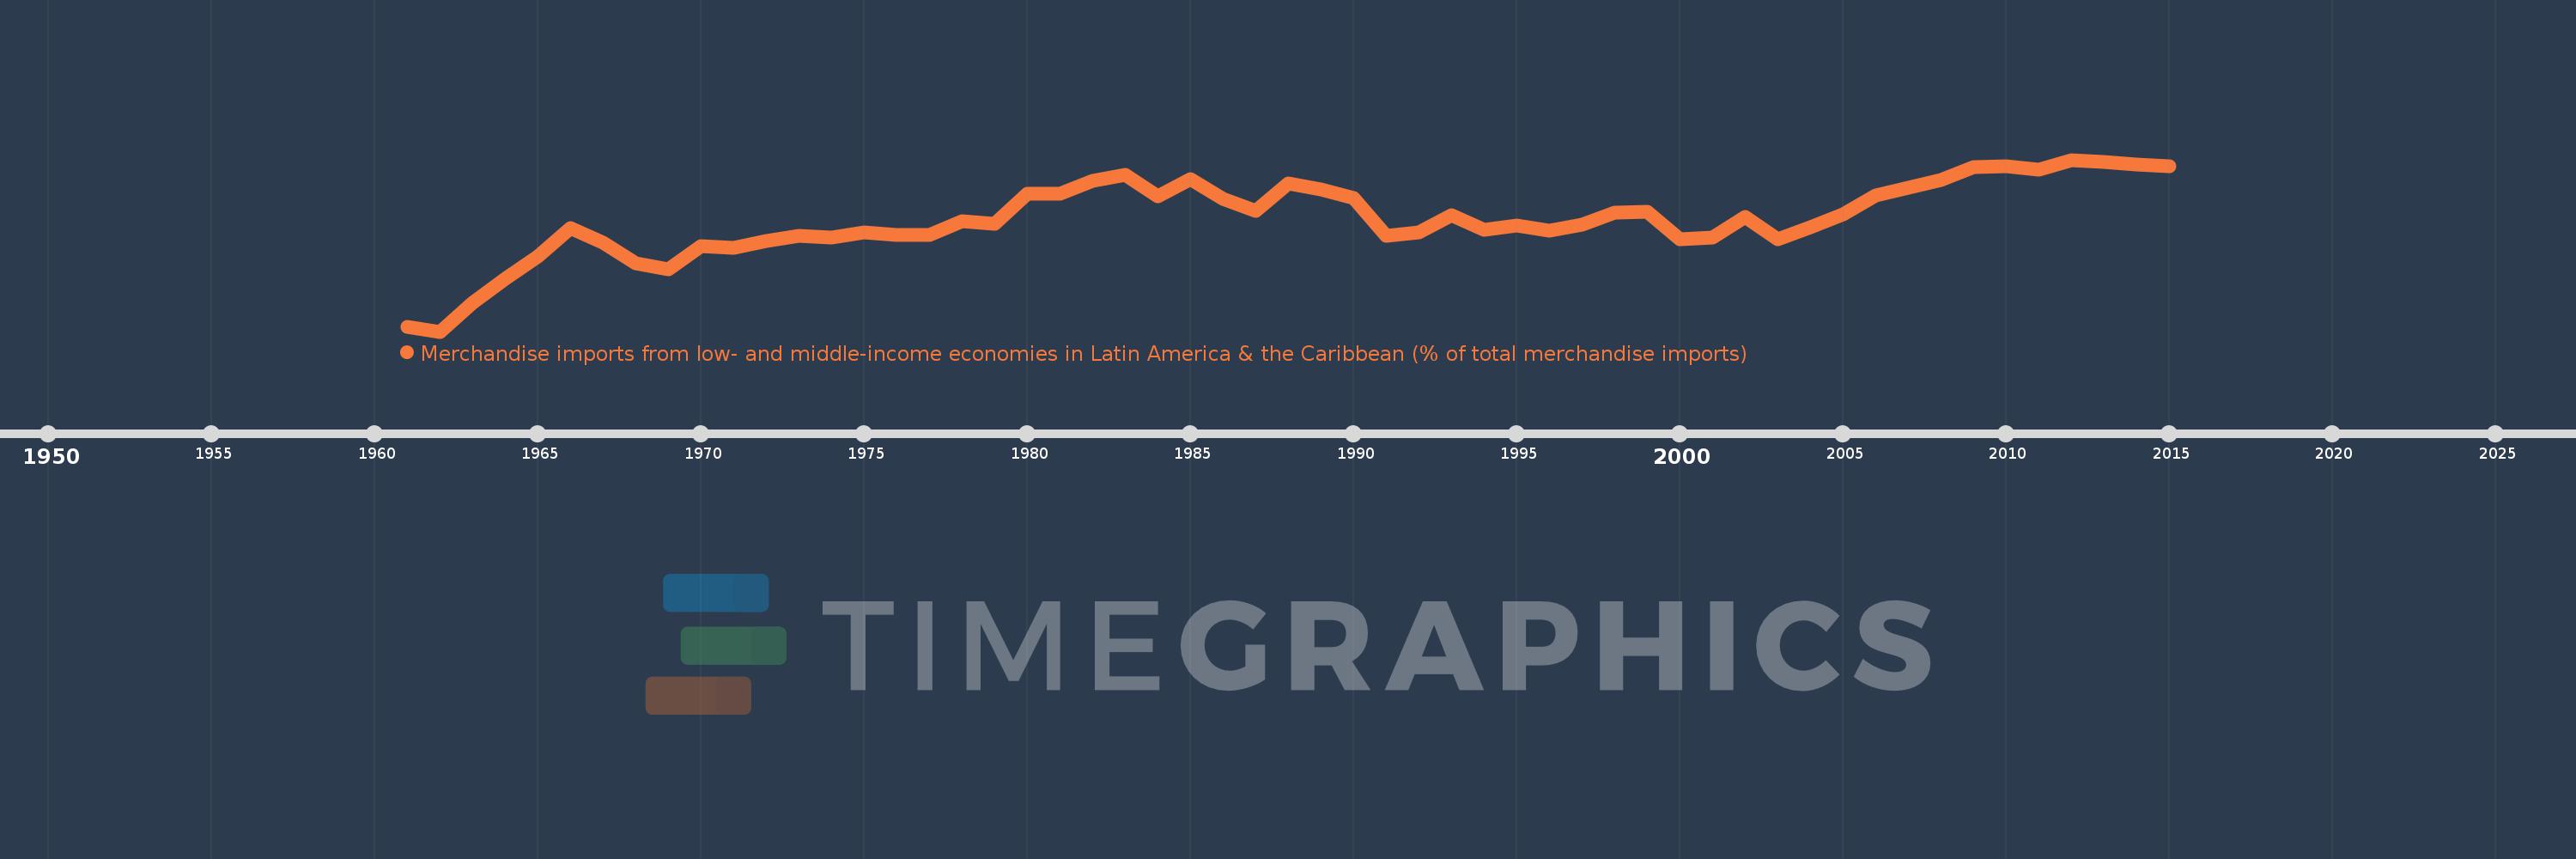
Merchandise imports from low- and middle-income economies in Latin America & the Caribbean (% of total merchandise imports)
2015,2014,2013,2012,2011,2010,2009,2008,2007,2006,2005,2004,2003,2002,2001,2000,1999,1998,1997,1996,1995,1994,1993,1992,1991,1990,1989,1988,1987,1986,1985,1984,1983,1982,1981,1980,1979,1978,1977,1976,1975,1974,1973,1972,1971,1970,1969,1968,1967,1966,1965,1964,1963,1962,1961
This statistics in other country:
AfghanistanAlbaniaAlgeriaAngolaAntigua and BarbudaArab WorldArgentinaArmeniaArubaAustraliaAustriaAzerbaijanBahamas, TheBahrainBangladeshBarbadosBelarusBelgiumBelizeBeninBermudaBoliviaBrazilBrunei DarussalamBulgariaBurkina FasoCabo VerdeCambodiaCameroonCanadaCaribbean small statesCentral African RepublicCentral Europe and the BalticsChileChinaColombiaCongo, Dem. Rep.Congo, Rep.Costa RicaCote d'IvoireCroatiaCubaCyprusCzech RepublicDenmarkDominicaDominican RepublicEarly-demographic dividendEast Asia & PacificEast Asia & Pacific (excluding high income)East Asia & Pacific (IDA & IBRD countries)EcuadorEgypt, Arab Rep.El SalvadorEstoniaEthiopiaEuro areaEurope & Central AsiaEurope & Central Asia (excluding high income)Europe & Central Asia (IDA & IBRD countries)European UnionFaroe IslandsFijiFinlandFragile and conflict affected situationsFranceFrench PolynesiaGabonGambia, TheGeorgiaGermanyGhanaGibraltarGreeceGreenlandGrenadaGuatemalaGuineaGuyanaHaitiHeavily indebted poor countries (HIPC)High incomeHondurasHong Kong SAR, ChinaHungaryIBRD onlyIcelandIDA & IBRD totalIDA blendIDA onlyIDA totalIndiaIndonesiaIran, Islamic Rep.IraqIrelandIsraelItalyJamaicaJapanJordanKazakhstanKenyaKorea, Dem. People’s Rep.Korea, Rep.KuwaitKyrgyz RepublicLate-demographic dividendLatin America & Caribbean Latin America & Caribbean (excluding high income)Latin America & the Caribbean (IDA & IBRD countries)LatviaLeast developed countries: UN classificationLebanonLiberiaLibyaLithuaniaLow & middle incomeLow incomeLower middle incomeLuxembourgMacao SAR, ChinaMacedonia, FYRMadagascarMalawiMalaysiaMaldivesMaliMaltaMauritaniaMauritiusMexicoMiddle East & North AfricaMiddle East & North Africa (excluding high income)Middle East & North Africa (IDA & IBRD countries)Middle incomeMoldovaMongoliaMontenegroMoroccoMozambiqueNetherlandsNew CaledoniaNew ZealandNicaraguaNigerNigeriaNorth AmericaNorwayOECD membersOmanOther small statesPacific island small statesPakistanPanamaPapua New GuineaParaguayPeruPhilippinesPolandPortugalPost-demographic dividendPre-demographic dividendQatarRomaniaRussian FederationSaudi ArabiaSenegalSerbiaSierra LeoneSingaporeSlovak RepublicSloveniaSmall statesSomaliaSouth AfricaSouth AsiaSouth Asia (IDA & IBRD)SpainSri LankaSt. Kitts and NevisSt. LuciaSt. Vincent and the GrenadinesSub-Saharan Africa Sub-Saharan Africa (excluding high income)Sub-Saharan Africa (IDA & IBRD countries)SudanSurinameSwedenSwitzerlandSyrian Arab RepublicTanzaniaThailandTogoTrinidad and TobagoTunisiaTurkeyUgandaUkraineUnited Arab EmiratesUnited KingdomUnited StatesUpper middle incomeUruguayVenezuela, RBVietnamWorldYemen, Rep.ZambiaZimbabwe Timeline:
This timeline shows a graph from 1961 to 2015 of IBRD only. No data until 1960. Number of actual observations by date: 55.
Source name:
World Development Indicators
Source organization:
World Bank staff estimates based data from International Monetary Fund's Direction of Trade database.
Categories, topics:
Private Sector, Trade
Last updated:
apr 23, 2017
Indicators value changes by year
At the date of observation
Value
Absolute change
Change from previous value
jan 1, 1961
1.95
+1.95
0.0%
jan 1, 1962
1.87
-0.08
-4.1%
jan 1, 1963
2.355
+0.484
25.91%
jan 1, 1964
2.747
+0.392
16.67%
jan 1, 1965
3.123
+0.376
13.68%
jan 1, 1966
3.586
+0.463
14.84%
jan 1, 1967
3.348
-0.238
-6.64%
jan 1, 1968
3.003
-0.345
-10.31%
jan 1, 1969
2.905
-0.098
-3.26%
jan 1, 1970
3.295
+0.391
13.45%
jan 1, 1971
3.261
-0.034
-1.04%
jan 1, 1972
3.376
+0.114
3.51%
jan 1, 1973
3.465
+0.089
2.64%
jan 1, 1974
3.43
-0.035
-1.0%
jan 1, 1975
3.524
+0.094
2.74%
jan 1, 1976
3.479
-0.045
-1.28%
jan 1, 1977
3.475
-0.004
-0.12%
jan 1, 1978
3.709
+0.235
6.75%
jan 1, 1979
3.668
-0.041
-1.1%
jan 1, 1980
4.159
+0.491
13.37%
jan 1, 1981
4.162
+0.003
0.08%
jan 1, 1982
4.382
+0.22
5.27%
jan 1, 1983
4.478
+0.096
2.2%
jan 1, 1984
4.119
-0.359
-8.01%
jan 1, 1985
4.405
+0.286
6.93%
jan 1, 1986
4.074
-0.331
-7.51%
jan 1, 1987
3.883
-0.192
-4.7%
jan 1, 1988
4.334
+0.452
11.63%
jan 1, 1989
4.239
-0.095
-2.2%
jan 1, 1990
4.085
-0.154
-3.64%
jan 1, 1991
3.456
-0.629
-15.39%
jan 1, 1992
3.522
+0.066
1.9%
jan 1, 1993
3.798
+0.277
7.86%
jan 1, 1994
3.557
-0.241
-6.35%
jan 1, 1995
3.637
+0.08
2.25%
jan 1, 1996
3.545
-0.092
-2.54%
jan 1, 1997
3.652
+0.107
3.02%
jan 1, 1998
3.844
+0.192
5.26%
jan 1, 1999
3.867
+0.023
0.6%
jan 1, 2000
3.405
-0.462
-11.94%
jan 1, 2001
3.434
+0.029
0.85%
jan 1, 2002
3.77
+0.336
9.79%
jan 1, 2003
3.405
-0.365
-9.69%
jan 1, 2004
3.607
+0.203
5.95%
jan 1, 2005
3.823
+0.216
5.98%
jan 1, 2006
4.133
+0.31
8.12%
jan 1, 2007
4.262
+0.129
3.12%
jan 1, 2008
4.386
+0.124
2.91%
jan 1, 2009
4.602
+0.216
4.92%
jan 1, 2010
4.626
+0.024
0.53%
jan 1, 2011
4.563
-0.063
-1.37%
jan 1, 2012
4.726
+0.163
3.58%
jan 1, 2013
4.694
-0.032
-0.68%
jan 1, 2014
4.653
-0.041
-0.88%
jan 1, 2015
4.614
-0.039
-0.84%
Ranking of countries by current statistics by years


Comments: