29
/
en
AIzaSyAYiBZKx7MnpbEhh9jyipgxe19OcubqV5w
April 1, 2024
286177
Zambia
ZMB
true
2
1
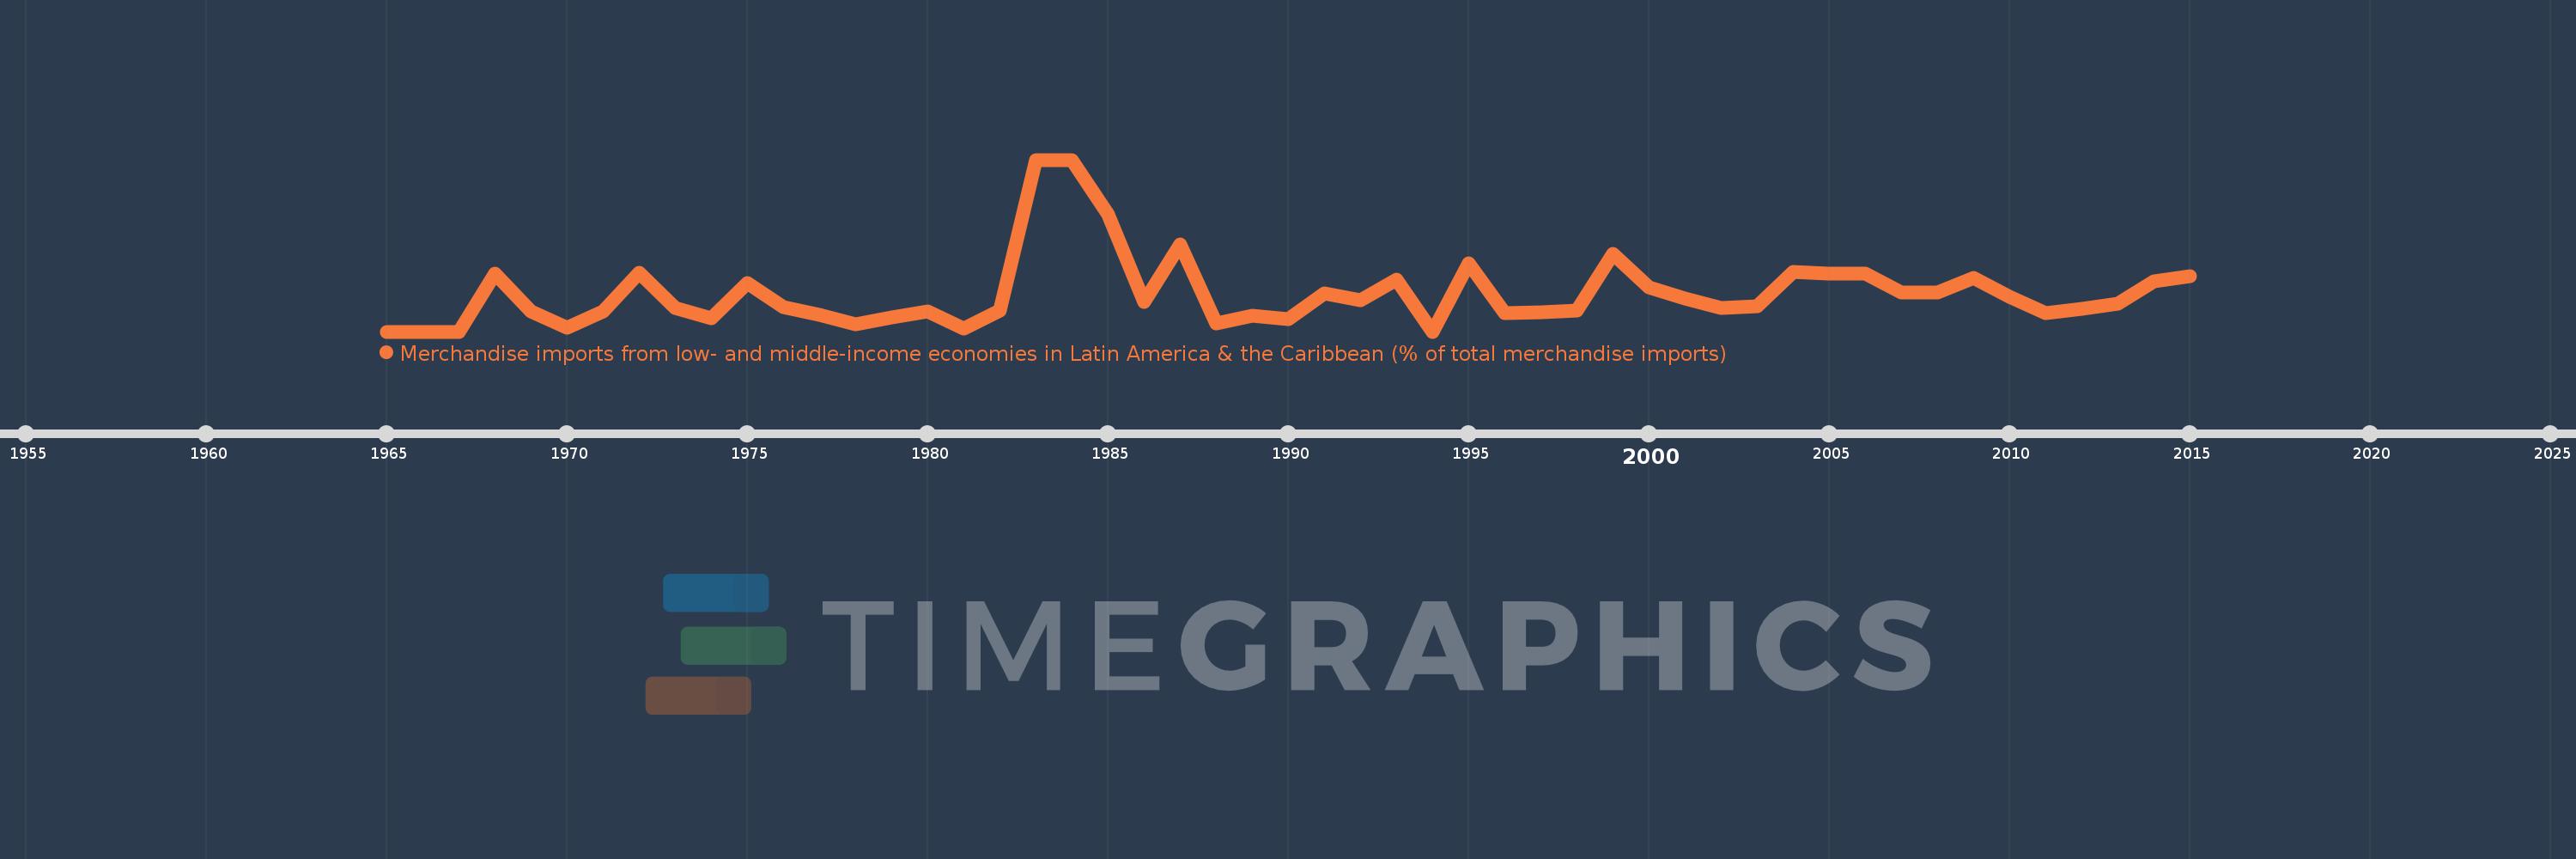
Merchandise imports from low- and middle-income economies in Latin America & the Caribbean (% of total merchandise imports)
2015,2014,2013,2012,2011,2010,2009,2008,2007,2006,2005,2004,2003,2002,2001,2000,1999,1998,1997,1996,1995,1994,1993,1992,1991,1990,1989,1988,1987,1986,1985,1984,1983,1982,1981,1980,1979,1978,1977,1976,1975,1974,1973,1972,1971,1970,1969,1968,1967,1966,1965
Global statistics library →Zambia →Merchandise imports from low- and middle-income economies in Latin America & the Caribbean (% of total merchandise imports)
This statistics in other country:
AfghanistanAlbaniaAlgeriaAngolaAntigua and BarbudaArab WorldArgentinaArmeniaArubaAustraliaAustriaAzerbaijanBahamas, TheBahrainBangladeshBarbadosBelarusBelgiumBelizeBeninBermudaBoliviaBrazilBrunei DarussalamBulgariaBurkina FasoCabo VerdeCambodiaCameroonCanadaCaribbean small statesCentral African RepublicCentral Europe and the BalticsChileChinaColombiaCongo, Dem. Rep.Congo, Rep.Costa RicaCote d'IvoireCroatiaCubaCyprusCzech RepublicDenmarkDominicaDominican RepublicEarly-demographic dividendEast Asia & PacificEast Asia & Pacific (excluding high income)East Asia & Pacific (IDA & IBRD countries)EcuadorEgypt, Arab Rep.El SalvadorEstoniaEthiopiaEuro areaEurope & Central AsiaEurope & Central Asia (excluding high income)Europe & Central Asia (IDA & IBRD countries)European UnionFaroe IslandsFijiFinlandFragile and conflict affected situationsFranceFrench PolynesiaGabonGambia, TheGeorgiaGermanyGhanaGibraltarGreeceGreenlandGrenadaGuatemalaGuineaGuyanaHaitiHeavily indebted poor countries (HIPC)High incomeHondurasHong Kong SAR, ChinaHungaryIBRD onlyIcelandIDA & IBRD totalIDA blendIDA onlyIDA totalIndiaIndonesiaIran, Islamic Rep.IraqIrelandIsraelItalyJamaicaJapanJordanKazakhstanKenyaKorea, Dem. People’s Rep.Korea, Rep.KuwaitKyrgyz RepublicLate-demographic dividendLatin America & Caribbean Latin America & Caribbean (excluding high income)Latin America & the Caribbean (IDA & IBRD countries)LatviaLeast developed countries: UN classificationLebanonLiberiaLibyaLithuaniaLow & middle incomeLow incomeLower middle incomeLuxembourgMacao SAR, ChinaMacedonia, FYRMadagascarMalawiMalaysiaMaldivesMaliMaltaMauritaniaMauritiusMexicoMiddle East & North AfricaMiddle East & North Africa (excluding high income)Middle East & North Africa (IDA & IBRD countries)Middle incomeMoldovaMongoliaMontenegroMoroccoMozambiqueNetherlandsNew CaledoniaNew ZealandNicaraguaNigerNigeriaNorth AmericaNorwayOECD membersOmanOther small statesPacific island small statesPakistanPanamaPapua New GuineaParaguayPeruPhilippinesPolandPortugalPost-demographic dividendPre-demographic dividendQatarRomaniaRussian FederationSaudi ArabiaSenegalSerbiaSierra LeoneSingaporeSlovak RepublicSloveniaSmall statesSomaliaSouth AfricaSouth AsiaSouth Asia (IDA & IBRD)SpainSri LankaSt. Kitts and NevisSt. LuciaSt. Vincent and the GrenadinesSub-Saharan Africa Sub-Saharan Africa (excluding high income)Sub-Saharan Africa (IDA & IBRD countries)SudanSurinameSwedenSwitzerlandSyrian Arab RepublicTanzaniaThailandTogoTrinidad and TobagoTunisiaTurkeyUgandaUkraineUnited Arab EmiratesUnited KingdomUnited StatesUpper middle incomeUruguayVenezuela, RBVietnamWorldYemen, Rep.ZambiaZimbabwe Timeline:
This timeline shows a graph from 1965 to 2015 of Zambia. No data until 1964. Number of actual observations by date: 51.
Source name:
World Development Indicators
Source organization:
World Bank staff estimates based data from International Monetary Fund's Direction of Trade database.
Categories, topics:
Private Sector, Trade
Last updated:
apr 23, 2017
Indicators value changes by year
At the date of observation
Value
Absolute change
Change from previous value
jan 1, 1968
0.321
+0.321
%
jan 1, 1969
0.109
-0.212
-66.01%
jan 1, 1970
0.019
-0.09
-82.44%
jan 1, 1971
0.11
+0.091
475.93%
jan 1, 1972
0.324
+0.214
193.72%
jan 1, 1973
0.129
-0.195
-60.12%
jan 1, 1974
0.072
-0.057
-43.96%
jan 1, 1975
0.265
+0.193
266.45%
jan 1, 1976
0.134
-0.132
-49.66%
jan 1, 1977
0.093
-0.04
-30.07%
jan 1, 1978
0.041
-0.052
-55.67%
jan 1, 1979
0.079
+0.038
91.02%
jan 1, 1980
0.111
+0.032
40.69%
jan 1, 1981
0.017
-0.094
-84.42%
jan 1, 1982
0.114
+0.096
555.26%
jan 1, 1983
0.946
+0.832
732.31%
jan 1, 1984
0.946
0.0
0.0%
jan 1, 1985
0.644
-0.302
-31.94%
jan 1, 1986
0.162
-0.481
-74.75%
jan 1, 1987
0.479
+0.317
194.8%
jan 1, 1988
0.046
-0.433
-90.43%
jan 1, 1989
0.086
+0.04
86.64%
jan 1, 1990
0.069
-0.016
-18.9%
jan 1, 1991
0.212
+0.142
204.88%
jan 1, 1992
0.172
-0.039
-18.65%
jan 1, 1993
0.286
+0.114
66.3%
jan 1, 1994
0.0
-0.286
-100.0%
jan 1, 1995
0.375
+0.375
%
jan 1, 1996
0.104
-0.271
-72.24%
jan 1, 1997
0.105
+0.001
1.12%
jan 1, 1998
0.116
+0.011
10.11%
jan 1, 1999
0.427
+0.311
268.36%
jan 1, 2000
0.245
-0.182
-42.52%
jan 1, 2001
0.181
-0.064
-26.21%
jan 1, 2002
0.131
-0.05
-27.39%
jan 1, 2003
0.14
+0.009
6.67%
jan 1, 2004
0.327
+0.186
132.94%
jan 1, 2005
0.317
-0.01
-3.07%
jan 1, 2006
0.321
+0.004
1.39%
jan 1, 2007
0.217
-0.104
-32.39%
jan 1, 2008
0.217
0.0
-0.23%
jan 1, 2009
0.296
+0.08
36.78%
jan 1, 2010
0.191
-0.105
-35.46%
jan 1, 2011
0.102
-0.089
-46.53%
jan 1, 2012
0.126
+0.024
23.62%
jan 1, 2013
0.155
+0.029
22.76%
jan 1, 2014
0.279
+0.124
79.92%
jan 1, 2015
0.305
+0.026
9.36%
Ranking of countries by current statistics by years


Comments: