29
/
en
AIzaSyAYiBZKx7MnpbEhh9jyipgxe19OcubqV5w
April 1, 2024
133406
Finland
FIN
true
2
1
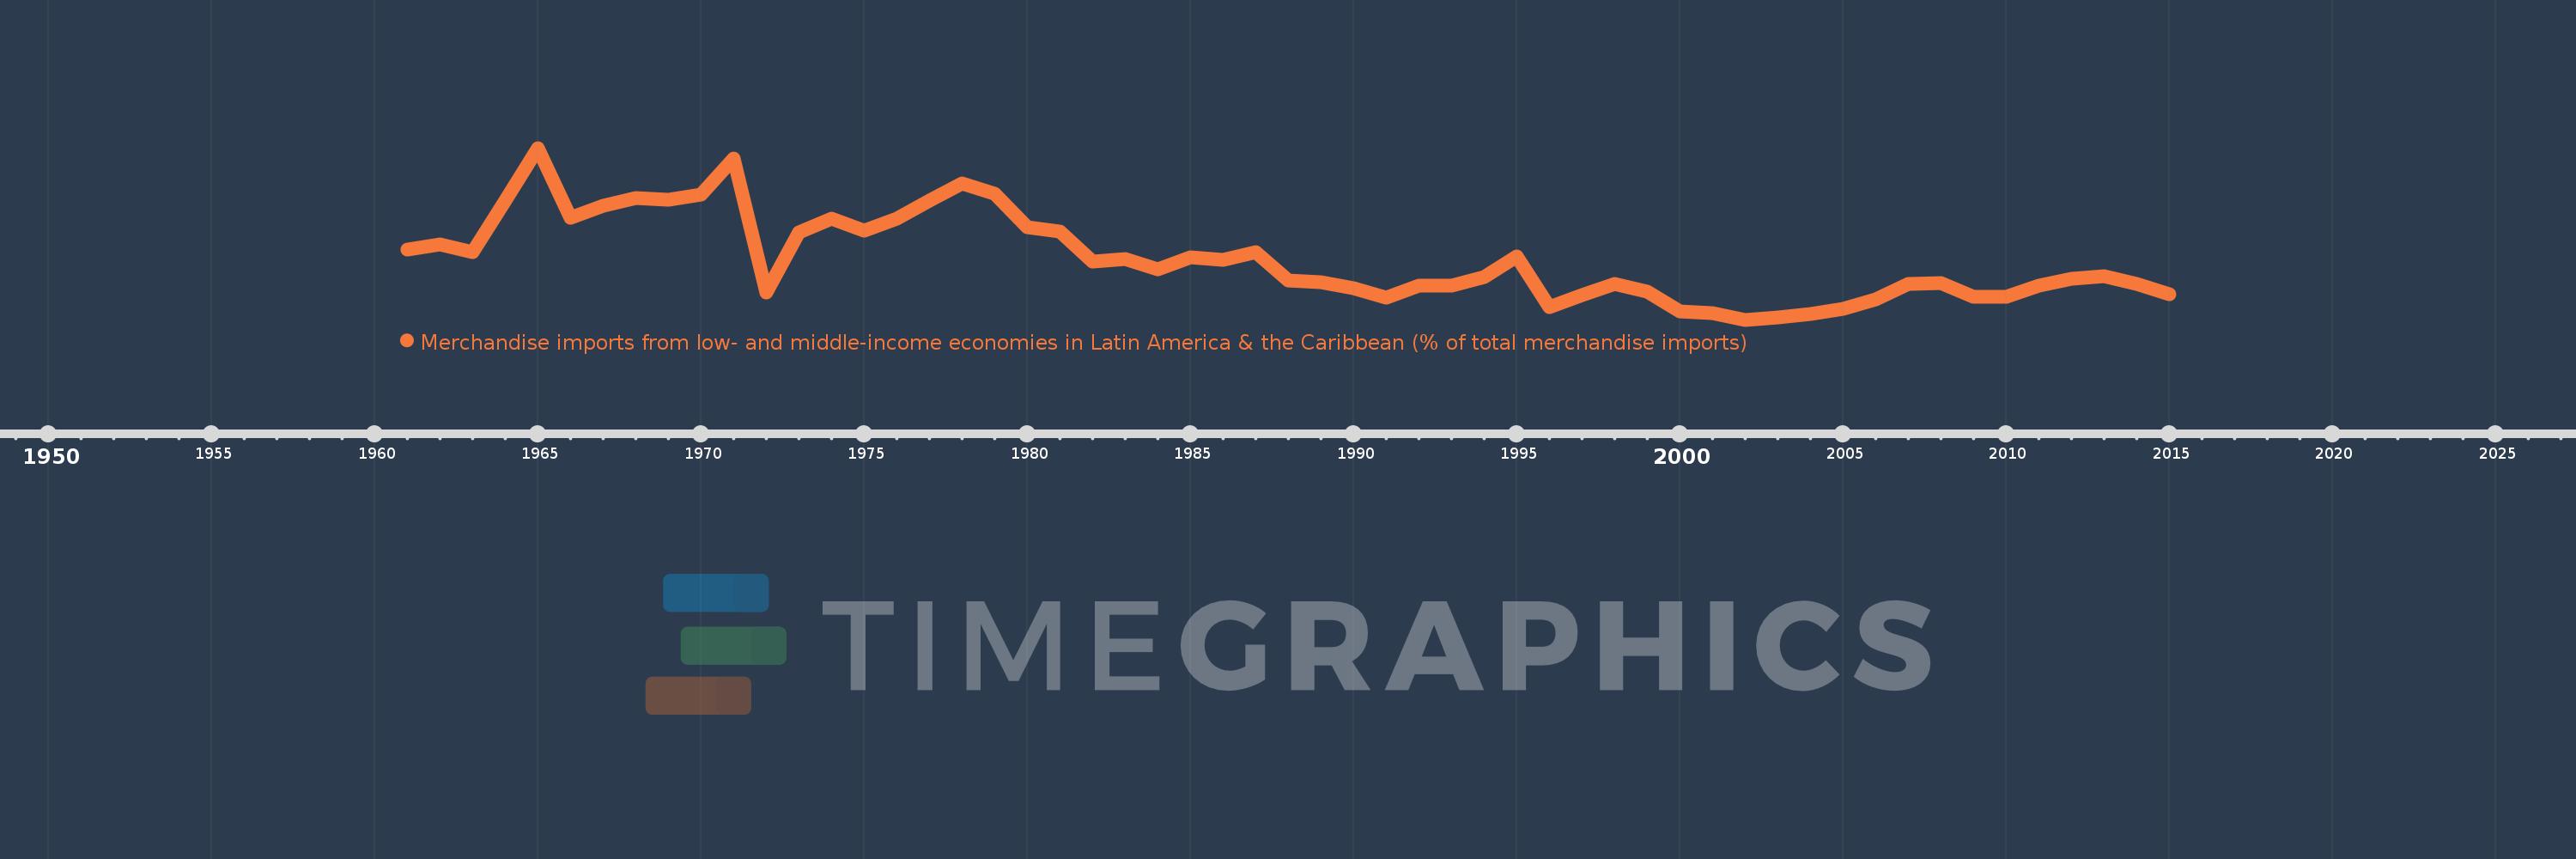
Merchandise imports from low- and middle-income economies in Latin America & the Caribbean (% of total merchandise imports)
2015,2014,2013,2012,2011,2010,2009,2008,2007,2006,2005,2004,2003,2002,2001,2000,1999,1998,1997,1996,1995,1994,1993,1992,1991,1990,1989,1988,1987,1986,1985,1984,1983,1982,1981,1980,1979,1978,1977,1976,1975,1974,1973,1972,1971,1970,1969,1968,1967,1966,1965,1964,1963,1962,1961
This statistics in other country:
AfghanistanAlbaniaAlgeriaAngolaAntigua and BarbudaArab WorldArgentinaArmeniaArubaAustraliaAustriaAzerbaijanBahamas, TheBahrainBangladeshBarbadosBelarusBelgiumBelizeBeninBermudaBoliviaBrazilBrunei DarussalamBulgariaBurkina FasoCabo VerdeCambodiaCameroonCanadaCaribbean small statesCentral African RepublicCentral Europe and the BalticsChileChinaColombiaCongo, Dem. Rep.Congo, Rep.Costa RicaCote d'IvoireCroatiaCubaCyprusCzech RepublicDenmarkDominicaDominican RepublicEarly-demographic dividendEast Asia & PacificEast Asia & Pacific (excluding high income)East Asia & Pacific (IDA & IBRD countries)EcuadorEgypt, Arab Rep.El SalvadorEstoniaEthiopiaEuro areaEurope & Central AsiaEurope & Central Asia (excluding high income)Europe & Central Asia (IDA & IBRD countries)European UnionFaroe IslandsFijiFinlandFragile and conflict affected situationsFranceFrench PolynesiaGabonGambia, TheGeorgiaGermanyGhanaGibraltarGreeceGreenlandGrenadaGuatemalaGuineaGuyanaHaitiHeavily indebted poor countries (HIPC)High incomeHondurasHong Kong SAR, ChinaHungaryIBRD onlyIcelandIDA & IBRD totalIDA blendIDA onlyIDA totalIndiaIndonesiaIran, Islamic Rep.IraqIrelandIsraelItalyJamaicaJapanJordanKazakhstanKenyaKorea, Dem. People’s Rep.Korea, Rep.KuwaitKyrgyz RepublicLate-demographic dividendLatin America & Caribbean Latin America & Caribbean (excluding high income)Latin America & the Caribbean (IDA & IBRD countries)LatviaLeast developed countries: UN classificationLebanonLiberiaLibyaLithuaniaLow & middle incomeLow incomeLower middle incomeLuxembourgMacao SAR, ChinaMacedonia, FYRMadagascarMalawiMalaysiaMaldivesMaliMaltaMauritaniaMauritiusMexicoMiddle East & North AfricaMiddle East & North Africa (excluding high income)Middle East & North Africa (IDA & IBRD countries)Middle incomeMoldovaMongoliaMontenegroMoroccoMozambiqueNetherlandsNew CaledoniaNew ZealandNicaraguaNigerNigeriaNorth AmericaNorwayOECD membersOmanOther small statesPacific island small statesPakistanPanamaPapua New GuineaParaguayPeruPhilippinesPolandPortugalPost-demographic dividendPre-demographic dividendQatarRomaniaRussian FederationSaudi ArabiaSenegalSerbiaSierra LeoneSingaporeSlovak RepublicSloveniaSmall statesSomaliaSouth AfricaSouth AsiaSouth Asia (IDA & IBRD)SpainSri LankaSt. Kitts and NevisSt. LuciaSt. Vincent and the GrenadinesSub-Saharan Africa Sub-Saharan Africa (excluding high income)Sub-Saharan Africa (IDA & IBRD countries)SudanSurinameSwedenSwitzerlandSyrian Arab RepublicTanzaniaThailandTogoTrinidad and TobagoTunisiaTurkeyUgandaUkraineUnited Arab EmiratesUnited KingdomUnited StatesUpper middle incomeUruguayVenezuela, RBVietnamWorldYemen, Rep.ZambiaZimbabwe Timeline:
This timeline shows a graph from 1961 to 2015 of Finland. No data until 1960. Number of actual observations by date: 55.
Source name:
World Development Indicators
Source organization:
World Bank staff estimates based data from International Monetary Fund's Direction of Trade database.
Categories, topics:
Private Sector, Trade
Last updated:
apr 23, 2017
Indicators value changes by year
At the date of observation
Value
Absolute change
Change from previous value
jan 1, 1961
2.268
+2.268
0.0%
jan 1, 1962
2.374
+0.106
4.69%
jan 1, 1963
2.215
-0.159
-6.69%
jan 1, 1964
3.219
+1.004
45.31%
jan 1, 1965
4.233
+1.014
31.5%
jan 1, 1966
2.881
-1.352
-31.95%
jan 1, 1967
3.121
+0.24
8.33%
jan 1, 1968
3.267
+0.146
4.67%
jan 1, 1969
3.234
-0.033
-1.0%
jan 1, 1970
3.324
+0.09
2.77%
jan 1, 1971
4.032
+0.709
21.33%
jan 1, 1972
1.439
-2.593
-64.3%
jan 1, 1973
2.6
+1.161
80.65%
jan 1, 1974
2.861
+0.26
10.02%
jan 1, 1975
2.637
-0.224
-7.82%
jan 1, 1976
2.874
+0.237
8.99%
jan 1, 1977
3.207
+0.333
11.57%
jan 1, 1978
3.543
+0.336
10.47%
jan 1, 1979
3.343
-0.199
-5.63%
jan 1, 1980
2.692
-0.651
-19.48%
jan 1, 1981
2.609
-0.083
-3.09%
jan 1, 1982
2.032
-0.578
-22.14%
jan 1, 1983
2.081
+0.05
2.45%
jan 1, 1984
1.881
-0.2
-9.6%
jan 1, 1985
2.126
+0.245
13.0%
jan 1, 1986
2.075
-0.051
-2.39%
jan 1, 1987
2.219
+0.143
6.91%
jan 1, 1988
1.674
-0.545
-24.55%
jan 1, 1989
1.64
-0.034
-2.02%
jan 1, 1990
1.518
-0.123
-7.47%
jan 1, 1991
1.337
-0.181
-11.93%
jan 1, 1992
1.568
+0.232
17.35%
jan 1, 1993
1.566
-0.002
-0.15%
jan 1, 1994
1.744
+0.178
11.38%
jan 1, 1995
2.139
+0.395
22.63%
jan 1, 1996
1.152
-0.987
-46.15%
jan 1, 1997
1.39
+0.238
20.68%
jan 1, 1998
1.61
+0.22
15.84%
jan 1, 1999
1.451
-0.159
-9.88%
jan 1, 2000
1.073
-0.378
-26.07%
jan 1, 2001
1.047
-0.026
-2.43%
jan 1, 2002
0.911
-0.136
-12.95%
jan 1, 2003
0.962
+0.05
5.54%
jan 1, 2004
1.025
+0.064
6.61%
jan 1, 2005
1.122
+0.097
9.45%
jan 1, 2006
1.3
+0.178
15.9%
jan 1, 2007
1.605
+0.305
23.43%
jan 1, 2008
1.613
+0.008
0.52%
jan 1, 2009
1.353
-0.26
-16.12%
jan 1, 2010
1.353
0.0
-0.02%
jan 1, 2011
1.577
+0.224
16.56%
jan 1, 2012
1.709
+0.132
8.38%
jan 1, 2013
1.758
+0.049
2.85%
jan 1, 2014
1.601
-0.157
-8.94%
jan 1, 2015
1.412
-0.189
-11.81%
Ranking of countries by current statistics by years


Comments: