29
/
en
AIzaSyAYiBZKx7MnpbEhh9jyipgxe19OcubqV5w
April 1, 2024
153797
Iceland
ISL
true
2
1
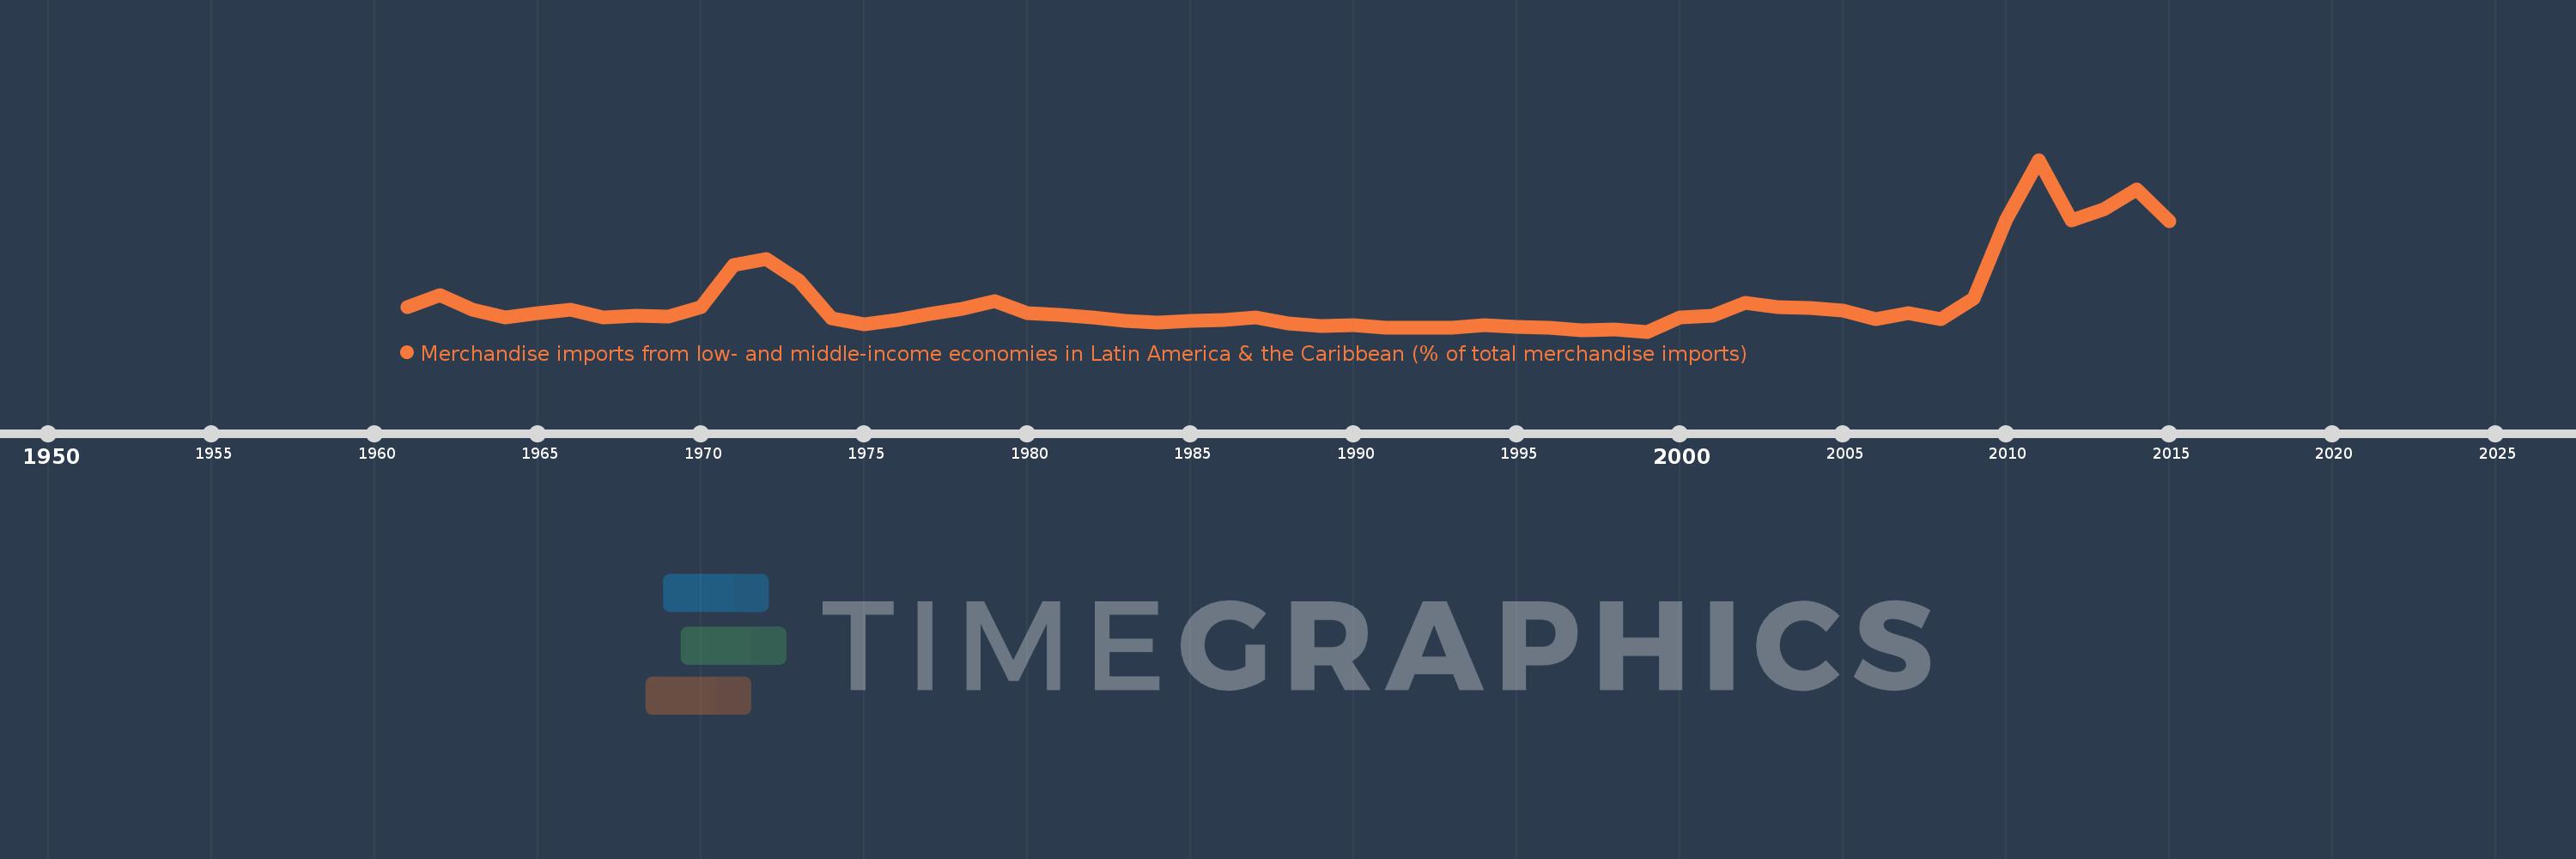
Merchandise imports from low- and middle-income economies in Latin America & the Caribbean (% of total merchandise imports)
2015,2014,2013,2012,2011,2010,2009,2008,2007,2006,2005,2004,2003,2002,2001,2000,1999,1998,1997,1996,1995,1994,1993,1992,1991,1990,1989,1988,1987,1986,1985,1984,1983,1982,1981,1980,1979,1978,1977,1976,1975,1974,1973,1972,1971,1970,1969,1968,1967,1966,1965,1964,1963,1962,1961
This statistics in other country:
AfghanistanAlbaniaAlgeriaAngolaAntigua and BarbudaArab WorldArgentinaArmeniaArubaAustraliaAustriaAzerbaijanBahamas, TheBahrainBangladeshBarbadosBelarusBelgiumBelizeBeninBermudaBoliviaBrazilBrunei DarussalamBulgariaBurkina FasoCabo VerdeCambodiaCameroonCanadaCaribbean small statesCentral African RepublicCentral Europe and the BalticsChileChinaColombiaCongo, Dem. Rep.Congo, Rep.Costa RicaCote d'IvoireCroatiaCubaCyprusCzech RepublicDenmarkDominicaDominican RepublicEarly-demographic dividendEast Asia & PacificEast Asia & Pacific (excluding high income)East Asia & Pacific (IDA & IBRD countries)EcuadorEgypt, Arab Rep.El SalvadorEstoniaEthiopiaEuro areaEurope & Central AsiaEurope & Central Asia (excluding high income)Europe & Central Asia (IDA & IBRD countries)European UnionFaroe IslandsFijiFinlandFragile and conflict affected situationsFranceFrench PolynesiaGabonGambia, TheGeorgiaGermanyGhanaGibraltarGreeceGreenlandGrenadaGuatemalaGuineaGuyanaHaitiHeavily indebted poor countries (HIPC)High incomeHondurasHong Kong SAR, ChinaHungaryIBRD onlyIcelandIDA & IBRD totalIDA blendIDA onlyIDA totalIndiaIndonesiaIran, Islamic Rep.IraqIrelandIsraelItalyJamaicaJapanJordanKazakhstanKenyaKorea, Dem. People’s Rep.Korea, Rep.KuwaitKyrgyz RepublicLate-demographic dividendLatin America & Caribbean Latin America & Caribbean (excluding high income)Latin America & the Caribbean (IDA & IBRD countries)LatviaLeast developed countries: UN classificationLebanonLiberiaLibyaLithuaniaLow & middle incomeLow incomeLower middle incomeLuxembourgMacao SAR, ChinaMacedonia, FYRMadagascarMalawiMalaysiaMaldivesMaliMaltaMauritaniaMauritiusMexicoMiddle East & North AfricaMiddle East & North Africa (excluding high income)Middle East & North Africa (IDA & IBRD countries)Middle incomeMoldovaMongoliaMontenegroMoroccoMozambiqueNetherlandsNew CaledoniaNew ZealandNicaraguaNigerNigeriaNorth AmericaNorwayOECD membersOmanOther small statesPacific island small statesPakistanPanamaPapua New GuineaParaguayPeruPhilippinesPolandPortugalPost-demographic dividendPre-demographic dividendQatarRomaniaRussian FederationSaudi ArabiaSenegalSerbiaSierra LeoneSingaporeSlovak RepublicSloveniaSmall statesSomaliaSouth AfricaSouth AsiaSouth Asia (IDA & IBRD)SpainSri LankaSt. Kitts and NevisSt. LuciaSt. Vincent and the GrenadinesSub-Saharan Africa Sub-Saharan Africa (excluding high income)Sub-Saharan Africa (IDA & IBRD countries)SudanSurinameSwedenSwitzerlandSyrian Arab RepublicTanzaniaThailandTogoTrinidad and TobagoTunisiaTurkeyUgandaUkraineUnited Arab EmiratesUnited KingdomUnited StatesUpper middle incomeUruguayVenezuela, RBVietnamWorldYemen, Rep.ZambiaZimbabwe Timeline:
This timeline shows a graph from 1961 to 2015 of Iceland. No data until 1960. Number of actual observations by date: 55.
Source name:
World Development Indicators
Source organization:
World Bank staff estimates based data from International Monetary Fund's Direction of Trade database.
Categories, topics:
Private Sector, Trade
Last updated:
apr 23, 2017
Indicators value changes by year
Maximum:
10.924
jan 1, 2011
At the date of observation
Value
Absolute change
Change from previous value
jan 1, 1961
1.822
+1.822
0.0%
jan 1, 1962
2.561
+0.738
40.52%
jan 1, 1963
1.685
-0.875
-34.18%
jan 1, 1964
1.192
-0.494
-29.3%
jan 1, 1965
1.454
+0.262
22.0%
jan 1, 1966
1.675
+0.221
15.23%
jan 1, 1967
1.193
-0.482
-28.76%
jan 1, 1968
1.3
+0.107
8.95%
jan 1, 1969
1.239
-0.061
-4.71%
jan 1, 1970
1.846
+0.607
49.02%
jan 1, 1971
4.405
+2.559
138.59%
jan 1, 1972
4.813
+0.408
9.26%
jan 1, 1973
3.485
-1.328
-27.58%
jan 1, 1974
1.123
-2.362
-67.77%
jan 1, 1975
0.75
-0.373
-33.23%
jan 1, 1976
1.023
+0.273
36.4%
jan 1, 1977
1.408
+0.385
37.63%
jan 1, 1978
1.715
+0.307
21.82%
jan 1, 1979
2.19
+0.475
27.68%
jan 1, 1980
1.482
-0.708
-32.32%
jan 1, 1981
1.348
-0.134
-9.03%
jan 1, 1982
1.204
-0.144
-10.71%
jan 1, 1983
0.981
-0.222
-18.46%
jan 1, 1984
0.872
-0.11
-11.16%
jan 1, 1985
0.976
+0.104
11.9%
jan 1, 1986
1.01
+0.034
3.53%
jan 1, 1987
1.206
+0.196
19.43%
jan 1, 1988
0.825
-0.381
-31.61%
jan 1, 1989
0.674
-0.151
-18.31%
jan 1, 1990
0.71
+0.036
5.38%
jan 1, 1991
0.552
-0.158
-22.3%
jan 1, 1992
0.577
+0.025
4.56%
jan 1, 1993
0.544
-0.033
-5.7%
jan 1, 1994
0.704
+0.16
29.43%
jan 1, 1995
0.629
-0.075
-10.67%
jan 1, 1996
0.57
-0.06
-9.47%
jan 1, 1997
0.418
-0.152
-26.63%
jan 1, 1998
0.446
+0.028
6.81%
jan 1, 1999
0.317
-0.13
-29.08%
jan 1, 2000
1.215
+0.898
283.87%
jan 1, 2001
1.319
+0.104
8.57%
jan 1, 2002
2.099
+0.78
59.15%
jan 1, 2003
1.821
-0.279
-13.27%
jan 1, 2004
1.767
-0.054
-2.98%
jan 1, 2005
1.637
-0.13
-7.33%
jan 1, 2006
1.091
-0.546
-33.34%
jan 1, 2007
1.463
+0.372
34.08%
jan 1, 2008
1.108
-0.355
-24.27%
jan 1, 2009
2.374
+1.266
114.24%
jan 1, 2010
7.255
+4.881
205.6%
jan 1, 2011
10.924
+3.67
50.58%
jan 1, 2012
7.159
-3.765
-34.47%
jan 1, 2013
7.885
+0.726
10.14%
jan 1, 2014
9.105
+1.221
15.48%
jan 1, 2015
7.106
-1.999
-21.95%
Ranking of countries by current statistics by years


Comments: