29
/
en
AIzaSyAYiBZKx7MnpbEhh9jyipgxe19OcubqV5w
April 1, 2024
40106
IDA total
IDA
false
2
1
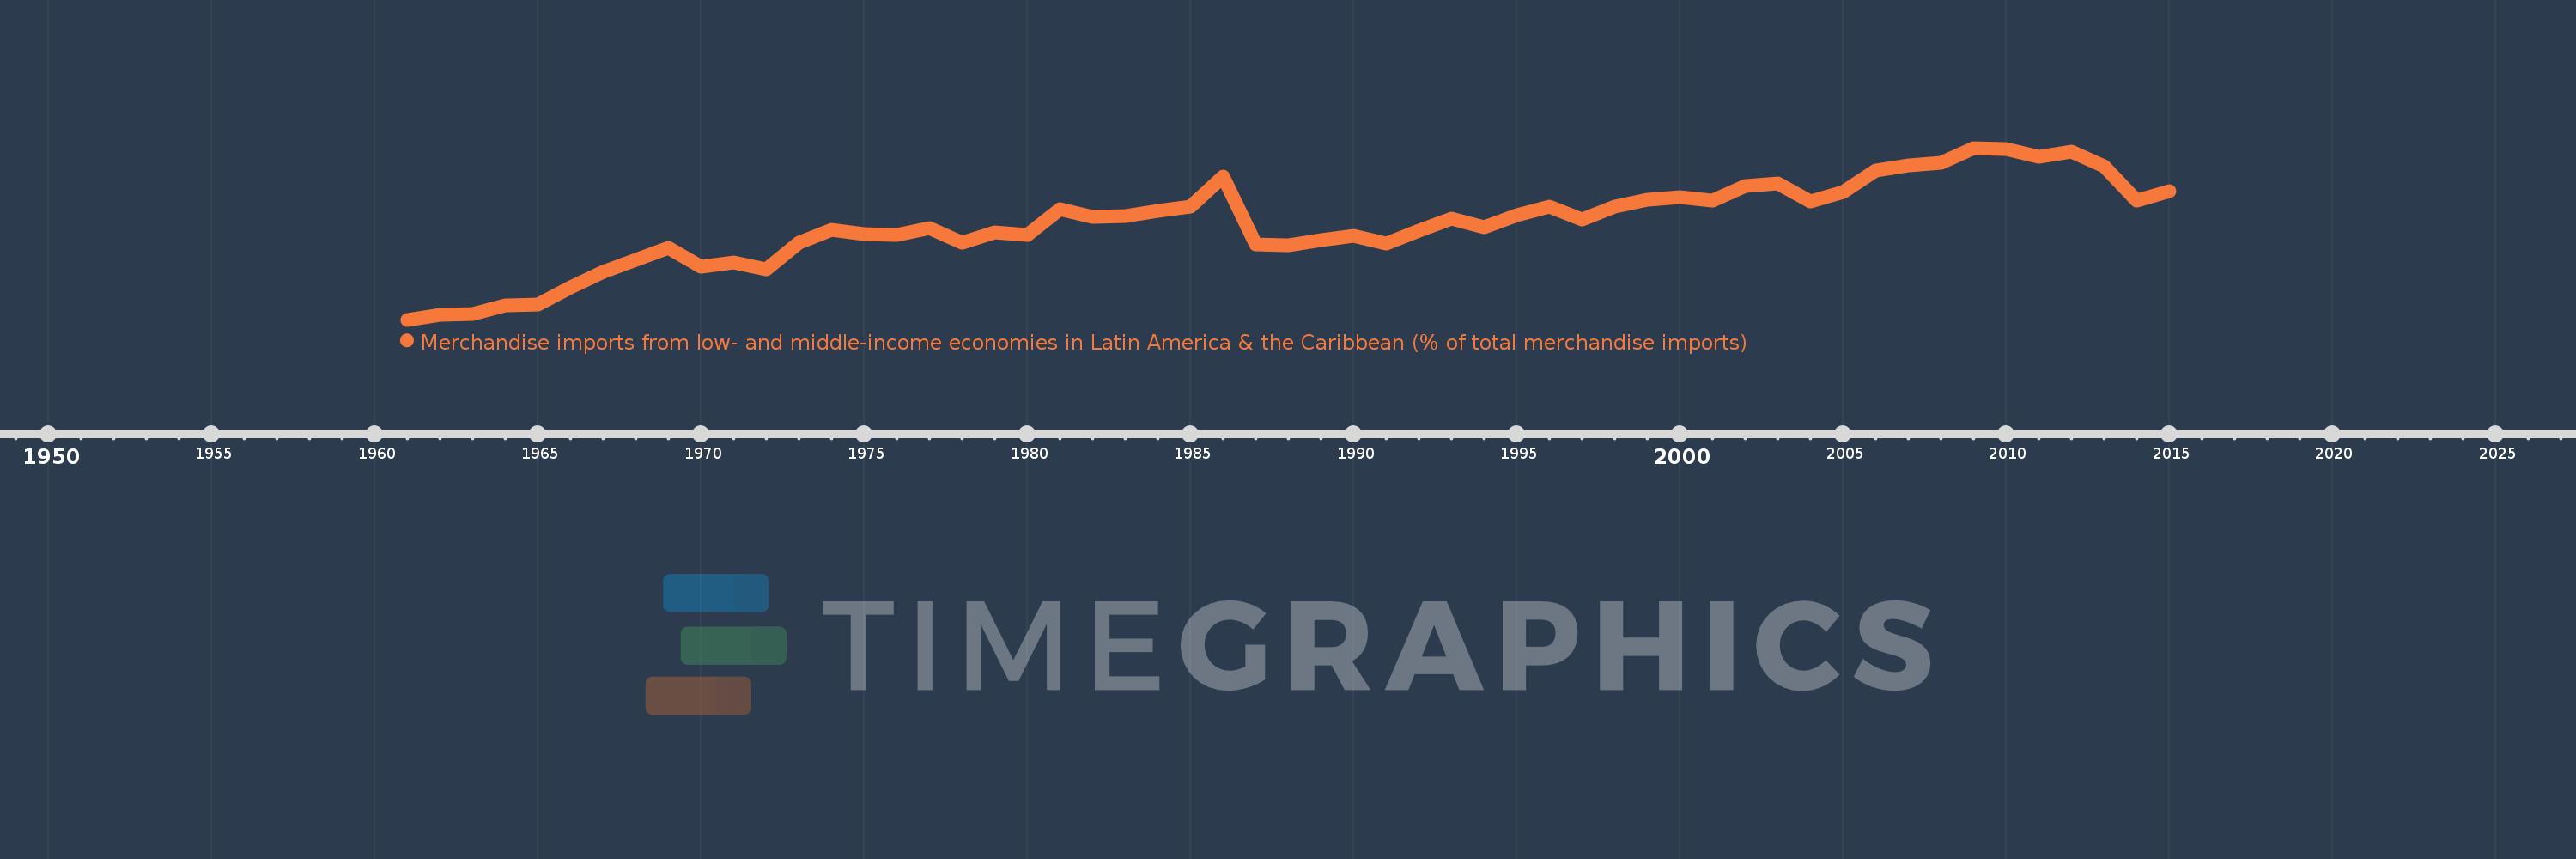
Merchandise imports from low- and middle-income economies in Latin America & the Caribbean (% of total merchandise imports)
2015,2014,2013,2012,2011,2010,2009,2008,2007,2006,2005,2004,2003,2002,2001,2000,1999,1998,1997,1996,1995,1994,1993,1992,1991,1990,1989,1988,1987,1986,1985,1984,1983,1982,1981,1980,1979,1978,1977,1976,1975,1974,1973,1972,1971,1970,1969,1968,1967,1966,1965,1964,1963,1962,1961
This statistics in other country:
AfghanistanAlbaniaAlgeriaAngolaAntigua and BarbudaArab WorldArgentinaArmeniaArubaAustraliaAustriaAzerbaijanBahamas, TheBahrainBangladeshBarbadosBelarusBelgiumBelizeBeninBermudaBoliviaBrazilBrunei DarussalamBulgariaBurkina FasoCabo VerdeCambodiaCameroonCanadaCaribbean small statesCentral African RepublicCentral Europe and the BalticsChileChinaColombiaCongo, Dem. Rep.Congo, Rep.Costa RicaCote d'IvoireCroatiaCubaCyprusCzech RepublicDenmarkDominicaDominican RepublicEarly-demographic dividendEast Asia & PacificEast Asia & Pacific (excluding high income)East Asia & Pacific (IDA & IBRD countries)EcuadorEgypt, Arab Rep.El SalvadorEstoniaEthiopiaEuro areaEurope & Central AsiaEurope & Central Asia (excluding high income)Europe & Central Asia (IDA & IBRD countries)European UnionFaroe IslandsFijiFinlandFragile and conflict affected situationsFranceFrench PolynesiaGabonGambia, TheGeorgiaGermanyGhanaGibraltarGreeceGreenlandGrenadaGuatemalaGuineaGuyanaHaitiHeavily indebted poor countries (HIPC)High incomeHondurasHong Kong SAR, ChinaHungaryIBRD onlyIcelandIDA & IBRD totalIDA blendIDA onlyIDA totalIndiaIndonesiaIran, Islamic Rep.IraqIrelandIsraelItalyJamaicaJapanJordanKazakhstanKenyaKorea, Dem. People’s Rep.Korea, Rep.KuwaitKyrgyz RepublicLate-demographic dividendLatin America & Caribbean Latin America & Caribbean (excluding high income)Latin America & the Caribbean (IDA & IBRD countries)LatviaLeast developed countries: UN classificationLebanonLiberiaLibyaLithuaniaLow & middle incomeLow incomeLower middle incomeLuxembourgMacao SAR, ChinaMacedonia, FYRMadagascarMalawiMalaysiaMaldivesMaliMaltaMauritaniaMauritiusMexicoMiddle East & North AfricaMiddle East & North Africa (excluding high income)Middle East & North Africa (IDA & IBRD countries)Middle incomeMoldovaMongoliaMontenegroMoroccoMozambiqueNetherlandsNew CaledoniaNew ZealandNicaraguaNigerNigeriaNorth AmericaNorwayOECD membersOmanOther small statesPacific island small statesPakistanPanamaPapua New GuineaParaguayPeruPhilippinesPolandPortugalPost-demographic dividendPre-demographic dividendQatarRomaniaRussian FederationSaudi ArabiaSenegalSerbiaSierra LeoneSingaporeSlovak RepublicSloveniaSmall statesSomaliaSouth AfricaSouth AsiaSouth Asia (IDA & IBRD)SpainSri LankaSt. Kitts and NevisSt. LuciaSt. Vincent and the GrenadinesSub-Saharan Africa Sub-Saharan Africa (excluding high income)Sub-Saharan Africa (IDA & IBRD countries)SudanSurinameSwedenSwitzerlandSyrian Arab RepublicTanzaniaThailandTogoTrinidad and TobagoTunisiaTurkeyUgandaUkraineUnited Arab EmiratesUnited KingdomUnited StatesUpper middle incomeUruguayVenezuela, RBVietnamWorldYemen, Rep.ZambiaZimbabwe Timeline:
This timeline shows a graph from 1961 to 2015 of IDA total. No data until 1960. Number of actual observations by date: 55.
Source name:
World Development Indicators
Source organization:
World Bank staff estimates based data from International Monetary Fund's Direction of Trade database.
Categories, topics:
Private Sector, Trade
Last updated:
apr 23, 2017
Indicators value changes by year
At the date of observation
Value
Absolute change
Change from previous value
jan 1, 1961
0.558
+0.558
0.0%
jan 1, 1962
0.643
+0.085
15.27%
jan 1, 1963
0.656
+0.013
2.0%
jan 1, 1964
0.81
+0.154
23.48%
jan 1, 1965
0.83
+0.02
2.47%
jan 1, 1966
1.117
+0.287
34.62%
jan 1, 1967
1.387
+0.27
24.12%
jan 1, 1968
1.605
+0.218
15.7%
jan 1, 1969
1.812
+0.208
12.95%
jan 1, 1970
1.483
-0.329
-18.17%
jan 1, 1971
1.566
+0.083
5.59%
jan 1, 1972
1.437
-0.129
-8.23%
jan 1, 1973
1.906
+0.469
32.62%
jan 1, 1974
2.123
+0.217
11.38%
jan 1, 1975
2.059
-0.064
-3.01%
jan 1, 1976
2.039
-0.02
-0.96%
jan 1, 1977
2.166
+0.127
6.2%
jan 1, 1978
1.908
-0.258
-11.92%
jan 1, 1979
2.09
+0.182
9.54%
jan 1, 1980
2.035
-0.055
-2.64%
jan 1, 1981
2.497
+0.462
22.71%
jan 1, 1982
2.359
-0.138
-5.51%
jan 1, 1983
2.366
+0.007
0.31%
jan 1, 1984
2.46
+0.094
3.97%
jan 1, 1985
2.529
+0.068
2.78%
jan 1, 1986
3.064
+0.535
21.17%
jan 1, 1987
1.869
-1.195
-39.01%
jan 1, 1988
1.854
-0.015
-0.79%
jan 1, 1989
1.948
+0.094
5.09%
jan 1, 1990
2.031
+0.083
4.24%
jan 1, 1991
1.895
-0.135
-6.67%
jan 1, 1992
2.112
+0.217
11.44%
jan 1, 1993
2.32
+0.207
9.82%
jan 1, 1994
2.173
-0.147
-6.32%
jan 1, 1995
2.391
+0.218
10.05%
jan 1, 1996
2.53
+0.138
5.79%
jan 1, 1997
2.312
-0.217
-8.59%
jan 1, 1998
2.532
+0.219
9.49%
jan 1, 1999
2.65
+0.118
4.67%
jan 1, 2000
2.706
+0.056
2.1%
jan 1, 2001
2.64
-0.066
-2.43%
jan 1, 2002
2.89
+0.25
9.46%
jan 1, 2003
2.939
+0.049
1.69%
jan 1, 2004
2.619
-0.319
-10.87%
jan 1, 2005
2.793
+0.173
6.62%
jan 1, 2006
3.166
+0.373
13.36%
jan 1, 2007
3.262
+0.096
3.05%
jan 1, 2008
3.307
+0.044
1.36%
jan 1, 2009
3.561
+0.254
7.69%
jan 1, 2010
3.544
-0.017
-0.48%
jan 1, 2011
3.405
-0.139
-3.92%
jan 1, 2012
3.502
+0.097
2.84%
jan 1, 2013
3.241
-0.26
-7.43%
jan 1, 2014
2.647
-0.594
-18.32%
jan 1, 2015
2.805
+0.158
5.95%
Ranking of countries by current statistics by years


Comments: